OK, I’ve stolen another title, this time from a favorite kids’ book. This post is really about the thyroid, which is a little less catchy than the spleen.
Your hormones are exciting!
They stir your body up.
They’re made by glands (called endocrine)
and give your body pluck.
Allan Wolf & Greg Clarke, The Blood-Hungry Spleen
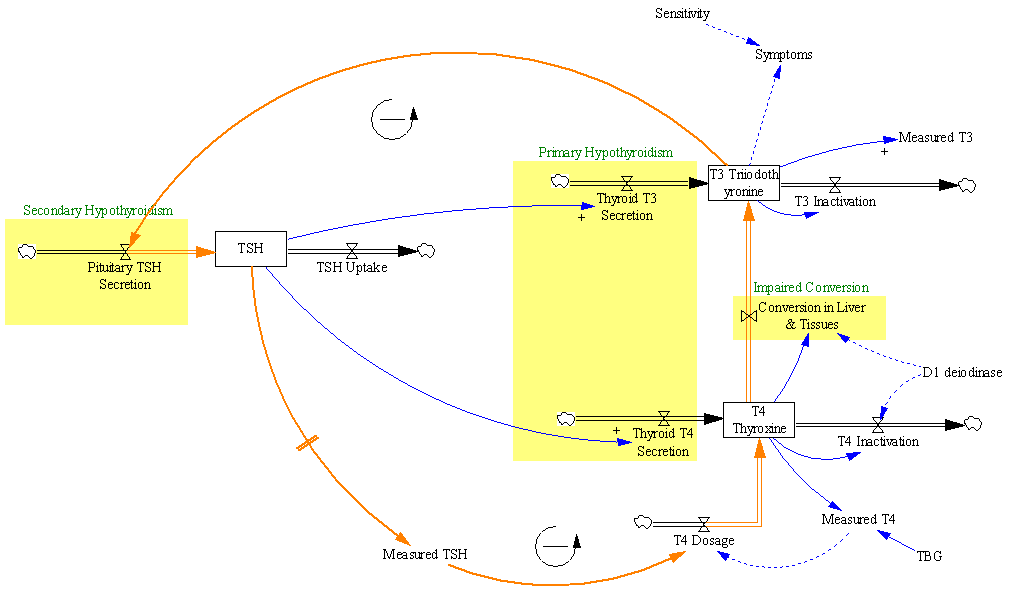
A friend has been diagnosed with hypothyroidism, so I did some digging on the workings of the thyroid. A few hours searching citations on PubMed, Medline and google gave me enough material to create this diagram:

(This is a LARGE image, so click through and zoom in to do it justice.)
The bottom half is the thyroid control system, as it is typically described. The top half strays into the insulin regulation system (borrowed from a classic SD model), body fat regulation, and other areas that seem related. A lot of the causal links above are speculative, and I have little hope of turning the diagram into a running model. Unfortunately, I can’t find anything in the literature that really digs into the dynamics of the system. In fact, I can’t even find the basics – how much stuff is in each stock, and how long does it stay there? There is a core of the system that I hope to get running at some point though:

(another largish image)
This is the part of the system that’s typically involved in the treatment of hypothyroidism with synthetic hormone replacements. Normally, the body runs a negative feedback loop in which thyroid hormone levels (T3/T4) govern production of TSH, which in turn controls the production of T3 and T4. The problem begins when something (perhaps an autoimmune disease, i.e. Hashimoto’s) diminishes the thyroid’s ability to produce T3 and T4 (reducing the two inflows in the big yellow box at center). Then therapy seeks to replace the natural control loop, by adjusting a dose of synthetic T4 (levothyroxine) until the measured level of TSH (left stock structure) reaches a desired target.
This is a negative feedback loop with fairly long delays, so dosage adjustments are made only at infrequent intervals, in order to allow the system to settle between changes. Otherwise, you’d have the aggressive shower taker problem: water’s to cold, crank up the hot water … ouch, too hot, turn it way down … eek, too cold …. Measurements of T3 and T4 are made, but seldom paid much heed – the TSH level is regarded as the “gold standard.”
This black box approach to control is probably effective for many patients, but it leaves me feeling uneasy about several things. The “normal” range for TSH varies by an order of magnitude; what basis is there for choosing one or the other end of the range as a target? Wouldn’t we expect variation among patients in the appropriate target level? How do we know that TSH levels are a reliable indicator, if they don’t correlate well with T3/T4 levels or symptoms? Are extremely sparse measurements of TSH really robust to variability on various time scales, or is dose titration vulnerable to noise?
One could imagine alternative approaches to control, using direct measurements of T3 and T4, or indirect measurements (symptoms). Those might have the advantage of less delay (fewer confounding states between the goal state and the measured state). But T3/T4 measurements seem to be regarded as unreliable, which might have something to do with the fact that it’s hard to find any information on the scale or dynamics of their reservoirs. Symptoms also take a back seat; one paper even demonstrates fairly convincingly that dosage changes +/- 25% have no effect on symptoms (so why are we doing this again?).
I’d like to have a more systemic understanding of both the internal dynamics of the thyroid regulation system, and its interaction with symptoms, behaviors, and other regulatory systems. Here’s hoping that one of you lurkers (I know you’re out there) can comment with some thoughts or references.
So the spleen doesn’t feel shortchanged, I’ll leave you with another favorite:
Lovely
I think that I ain’t never seen
A poem ugly as a spleen.
A poem that could make you shiver
Like 3.5 … pounds of liver.
A poem to make you lose your lunch,
Tie your intestines in a bunch.
A poem all gray, wet, and swollen,
Like a stomach or a colon.
Something like your kidney, lung,
Pancreas, bladder, even tongue.
Why you turning green, good buddy?
It’s just human body study.
John Scieszka & Lane Smith, Science Verse


