Assessing the predictability of nonlinear dynamics

An interesting exploration of the limits of data-driven predictions in nonlinear dynamic problems:

Assessing the predictability of nonlinear dynamics under smooth parameter changes
Simone Cenci, Lucas P. Medeiros, George Sugihara and Serguei Saavedra
https://doi.org/10.1098/rsif.2019.0627

Short-term forecasts of nonlinear dynamics are important for risk-assessment studies and to inform sustainable decision-making for physical, biological and financial problems, among others. Generally, the accuracy of short-term forecasts depends upon two main factors: the capacity of learning algorithms to generalize well on unseen data and the intrinsic predictability of the dynamics. While generalization skills of learning algorithms can be assessed with well-established methods, estimating the predictability of the underlying nonlinear generating process from empirical time series remains a big challenge. Here, we show that, in changing environments, the predictability of nonlinear dynamics can be associated with the time-varying stability of the system with respect to smooth changes in model parameters, i.e. its local structural stability. Using synthetic data, we demonstrate that forecasts from locally structurally unstable states in smoothly changing environments can produce significantly large prediction errors, and we provide a systematic methodology to identify these states from data. Finally, we illustrate the practical applicability of our results using an empirical dataset. Overall, this study provides a framework to associate an uncertainty level with short-term forecasts made in smoothly changing environments.

Causality in nonlinear systems

Sugihara et al. have a really interesting paper in Science, on detection of causality in nonlinear dynamic systems. It’s paywalled, so here’s an excerpt with some comments.

Abstract: Identifying causal networks is important for effective policy and management recommendations on climate, epidemiology, financial regulation, and much else. We introduce a method, based on nonlinear state space reconstruction, that can distinguish causality from correlation. It extends to nonseparable weakly connected dynamic systems (cases not covered by the current Granger causality paradigm). The approach is illustrated both by simple models (where, in contrast to the real world, we know the underlying equations/relations and so can check the validity of our method) and by application to real ecological systems, including the controversial sardine-anchovy-temperature problem.

Identifying causality in complex systems can be difficult. Contradictions arise in many scientific contexts where variables are positively coupled at some times but at other times appear unrelated or even negatively coupled depending on system state.

Although correlation is neither necessary nor sufficient to establish causation, it remains deeply ingrained in our heuristic thinking. … the use of correlation to infer causation is risky, especially as we come to recognize that nonlinear dynamics are ubiquitous. Continue reading “Causality in nonlinear systems”

Forest Cover Tipping Points

This is a model of forest stability and transitions, inspired by:

Global Resilience of Tropical Forest and Savanna to Critical Transitions

Marina Hirota, Milena Holmgren, Egbert H. Van Nes, Marten Scheffer

It has been suggested that tropical forest and savanna could represent alternative stable states, implying critical transitions at tipping points in response to altered climate or other drivers. So far, evidence for this idea has remained elusive, and integrated climate models assume smooth vegetation responses. We analyzed data on the distribution of tree cover in Africa, Australia, and South America to reveal strong evidence for the existence of three distinct attractors: forest, savanna, and a treeless state. Empirical reconstruction of the basins of attraction indicates that the resilience of the states varies in a universal way with precipitation. These results allow the identification of regions where forest or savanna may most easily tip into an alternative state, and they pave the way to a new generation of coupled climate models.

The paper is worth a read. It doesn’t present an explicit simulation model, but it does describe the concept nicely. I built the following toy model as a loose interpretation of the dynamics.

Some things to try:

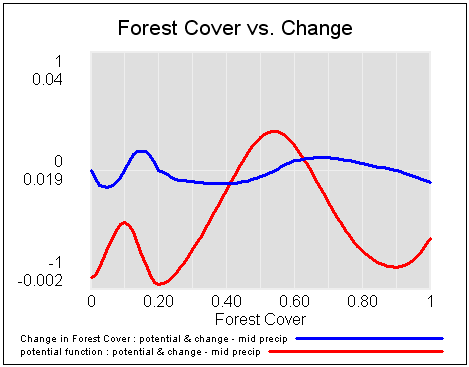
Use a Synthesim override to replace Forest Cover with a ramp from 0 to 1 to see potentials and vector fields (rates of change), then vary the precipitation index to see how the stability of the forest, savanna and treeless states changes:


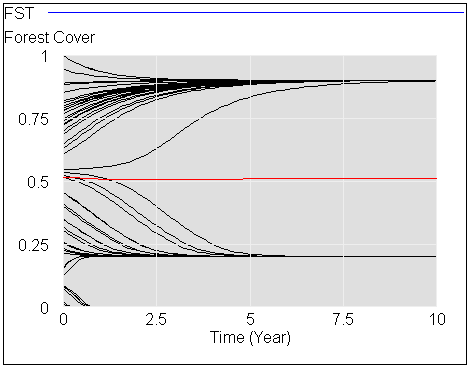
Start the system at different levels of forest cover (varying init forest cover), with default precipitation, to see the three stable attractors at zero trees, savanna (20% tree cover) and forest (90% tree cover):

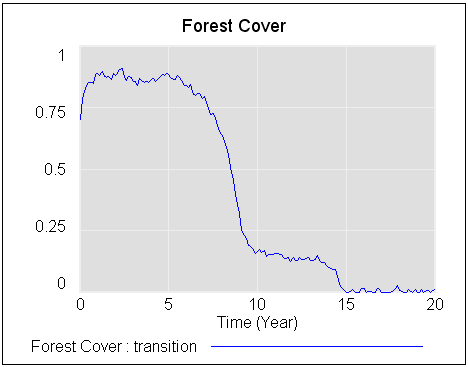
Start with a stable forest, and a bit of noise (noise sd = .2 to .3), then gradually reduce precipitation (override the precipitation index with a ramp from 1 to 0) to see abrupt transitions in state:

There’s a more detailed discussion on my blog.

forest savanna treeless 1f.mdl (requires an advanced version of Vensim, or the free Model Reader)

forest savanna treeless 1f.vpm (ditto; includes a sensitivity file for varying the initial forest cover)

Bifurcations from Strogatz’ Nonlinear Dynamics and Chaos

The following models are replicated from Steven Strogatz’ excellent text, Nonlinear Dynamics and Chaos.

These are just a few of the many models in the text. They illustrate bifurcations in one-dimensional systems (saddle node, transcritical, pitchfork) and one two-dimensional system (Hopf). The pitchfork bifurcation is closely related to the cusp catastrophe in the climate model recently posted.

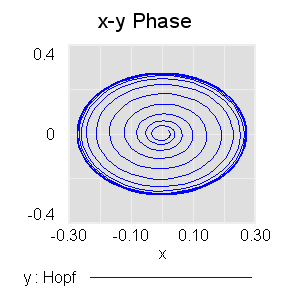
Spiral from a point near the unstable fixed point at the origin to a stable limit cycle after a Hopf bifurcation (mu=.075, r0 = .025)

These are in support of an upcoming post on bifurcations and tipping points, so I won’t say more at the moment. I encourage you to read the book. If you replicate more of the models in it, I’d love to have copies here.

These are systems in normal form and therefore dimensionless and lacking in physical interpretation, though they certainly crop up in many real-world systems.

3-1 saddle node bifurcation.mdl

3-2 transcritical bifurcation.mdl

3-4 pitchfork bifurcation.mdl

8.2 Hopf bifurcation.mdl

Update: A related generic model illustrating critical slowing down:

critical slowing.mdl

Bifurcating Salmon

A nifty paper on nonlinear dynamics of salmon populations caught my eye on ArXiv.org today. The math is straightforward and elegant, so I replicated the model in Vensim.

A three-species model explaining cyclic dominance of pacific salmon

Authors: Christian Guill, Barbara Drossel, Wolfram Just, Eddy Carmack

Abstract: The four-year oscillations of the number of spawning sockeye salmon (Oncorhynchus nerka) that return to their native stream within the Fraser River basin in Canada are a striking example of population oscillations. The period of the oscillation corresponds to the dominant generation time of these fish. Various – not fully convincing – explanations for these oscillations have been proposed, including stochastic influences, depensatory fishing, or genetic effects. Here, we show that the oscillations can be explained as a stable dynamical attractor of the population dynamics, resulting from a strong resonance near a Neimark Sacker bifurcation. This explains not only the long-term persistence of these oscillations, but also reproduces correctly the empirical sequence of salmon abundance within one period of the oscillations. Furthermore, it explains the observation that these oscillations occur only in sockeye stocks originating from large oligotrophic lakes, and that they are usually not observed in salmon species that have a longer generation time.

The paper does a nice job of connecting behavior to structure, and of relating the emergence of oscillations to eigenvalues in the linearized system.

Units balance, though I had to add a couple implicit scale factors to do so.

The general results are qualitatitively replicable. I haven’t tried to precisely reproduce the authors’ bifurcation diagram and other experiments, in part because I couldn’t find a precise specification of numerical methods used (time step, integration method), so I wouldn’t expect to succeed.

Unlike most SD models, this is a hybrid discrete-continuous system. Salmon, predator and zooplankton populations evolve continuously during a growing season, but with discrete transitions between seasons.

The model uses SAMPLE IF TRUE, so you need an advanced version of Vensim to run it, or the free Model Reader. (It should be possible to replace the SAMPLE IF TRUE if an enterprising person wanted a PLE version). It would also be a good candidate for an application of SHIFT IF TRUE if someone wanted to experiment with the cohort age structure.

sockeye.vmf

For a more policy-oriented take on salmon, check out Andy Ford’s work on smolt migration.