A selection of data and projections on past and future climate in Montana:
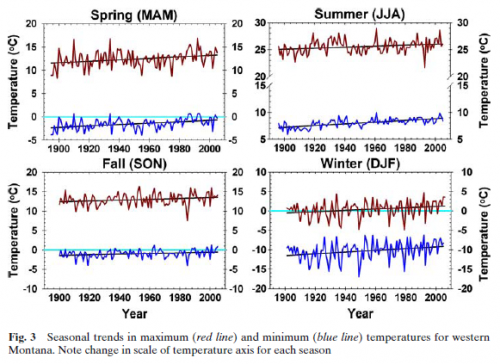
Pederson et al. (2010) A century of climate and ecosystem change in Western Montana: what do temperature trends portend? Climatic Change 98:133-154. It’s hard to read precisely off the graph, but there have been significant increases in maximum and minimum temperatures, with the greatest increases in the minimums and in winter – exactly what you’d expect from a change in radiative properties. As a result the daily temperature range has shrunk slightly and there are fewer below freezing and below zero days. That last metric is critical, because it’s the severe cold that controls many forest pests. There’s much more on this in a poster.
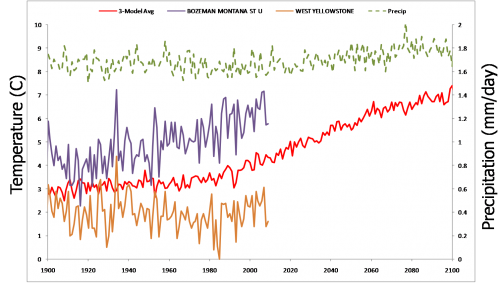
Not every station shows a trend – the figure above contrasts Bozeman (purple, strong trend) with West Yellowstone (orange, flat). The Bozeman trend is probably not an urban heat island effect – surfacestations.org thinks it’s a good site, and White Sulphur (a nice sleepy town up the road a piece) is about the same. The red line is an ensemble of simulations (GISS, CCSM & ECHAM5) from climexp.knmi.nl, projected into the future with A1B forcings (i.e., a fairly high emissions trajectory). I interpolated the data to latitude 47.6, longitude -110.9 (roughly my house, near Bozeman). Simulated temperature rises about 4C, while precipitation (green) is almost unmoved. If that came true, Montana’s future climate might be a lot like current central Utah.
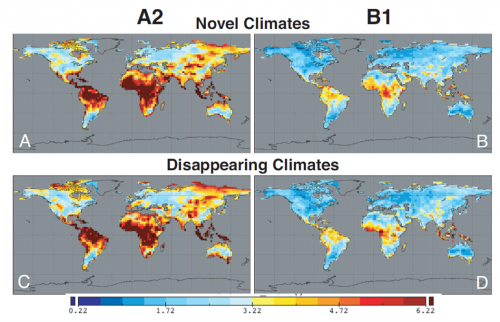
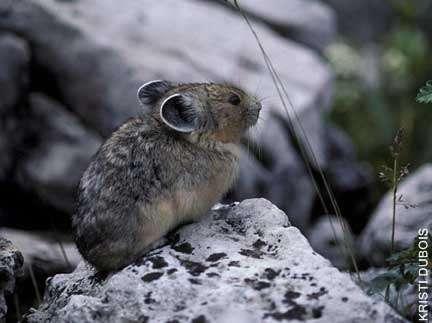
The figure above – from John W. Williams, Stephen T. Jackson, and John E. Kutzbach. Projected distributions of novel and disappearing climates by 2100 AD. PNAS, vol. 104 no. 14 – shows global grid points that have no neighbors within 500km that now have a climate like what the future might bring. In panel C (disappearing climates with the high emissions A2 scenario), there’s a hotspot right over Montana. Presumably that’s loss of today’s high altitude ecosystems. As it warms up, climate zones move uphill, but at the top of mountains there’s nowhere to go. That’s why pikas may be in trouble.

