
Last Wednesday, President Bush called for the US to halt the growth of greenhouse gas emissions by 2025:
‘It is now time for the U.S. to look beyond 2012 and take the next step,’ Mr. Bush said, a reference to his previously stated national goal, announced in 2002, of an 18 percent reduction in the growth of emissions of heat-trapping gases relative to economic growth by 2012. Mr. Bush said the nation was on track to meeting that target. – NYT
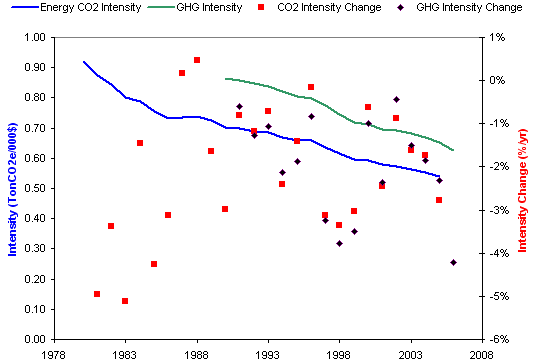
Those who remember the 2002 commitment may recall that, at the time, emissions intensity had historically fallen by 1.3% per year on its own, so that the administration policy actually committed only to an additional 0.4% decline (assuming continuity with history). With GDP growth at about 3% per year, that would leave absolute emissions growing at about 1.7% per year. In fact, intensity has fallen about 2.5% per year since 2002, with much of that in 2006. Since it’s way too soon for investments in climate-related R&D to be having any effect, it’s likely that the savings are due to $100 oil. That is not an emissions reduction method that is likely to pass a cost-benefit test.
In the context of the long term,-2.5% over 4 years is still hard to separate from noise. Even the 2006 reduction (last black point) does not approach reductions in the OPEC era, nor does recent performance stand out amid the 4-year smoothed trend for US emissions intensity over 200 years:
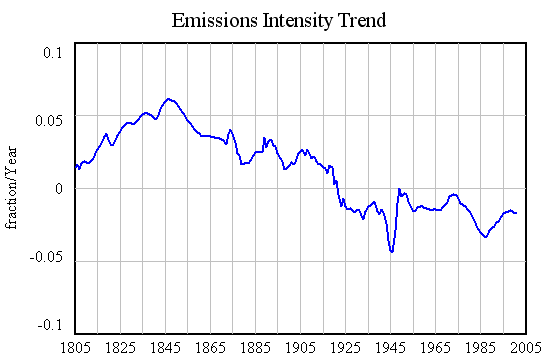
Source: Maddison (GDP) & Marland & Boden (CO2)
In early 2003, I downloaded the following schematic from a White House or DOE web site (unfortunately I don’t recall which):
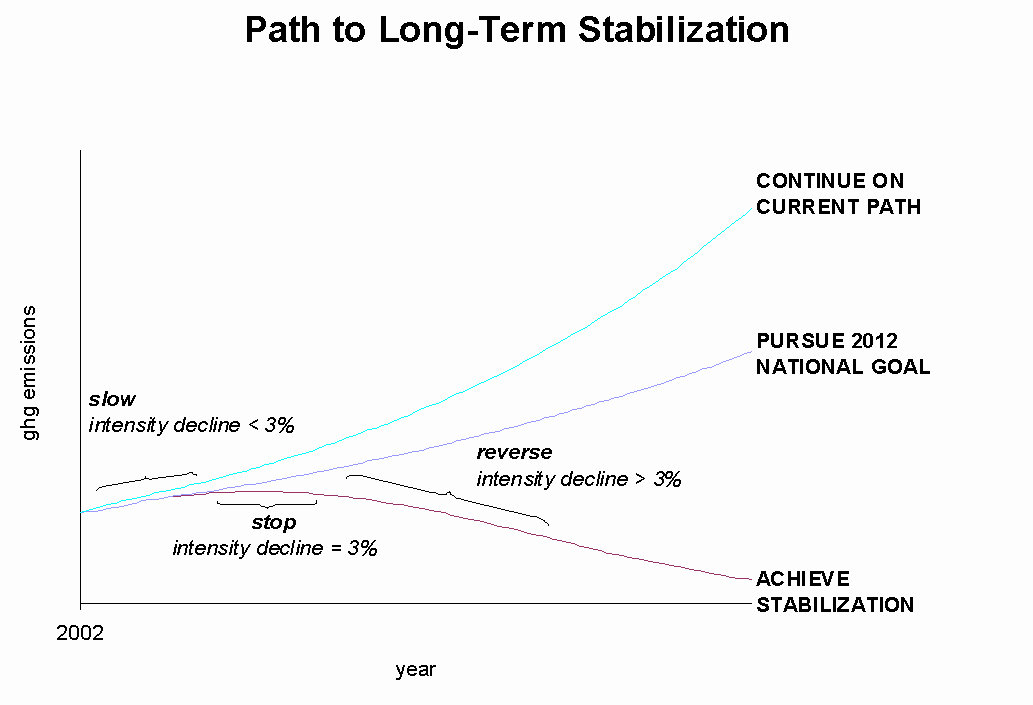
The new administration policy represents a change from the purple 2012 National Goal trajectory to the first half of the burgundy “stop” trajectory (up to the “t” in stop, representing 2025).* I used a simple scenario-generating model tuned to EIA data to put hard numbers to the figure above. Here are three scenarios: business-as-usual (blue, GDP growing 3%/yr, intensity falling 1.4%/yr), the 2012 goal (intensity falling an additional 0.4%/yr from 2002), and the 2025 goal (red, intensity reduction gradually increasing from 1.8%/yr in 2008 to match GDP growth in 2025).
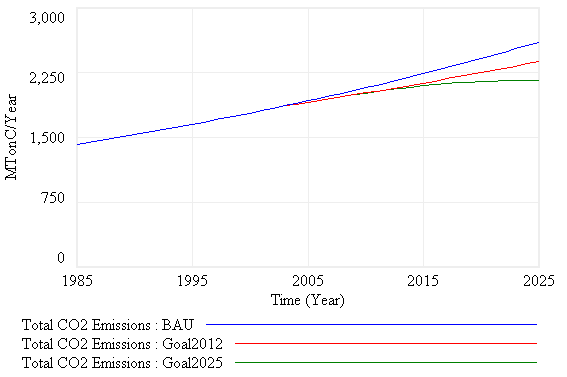
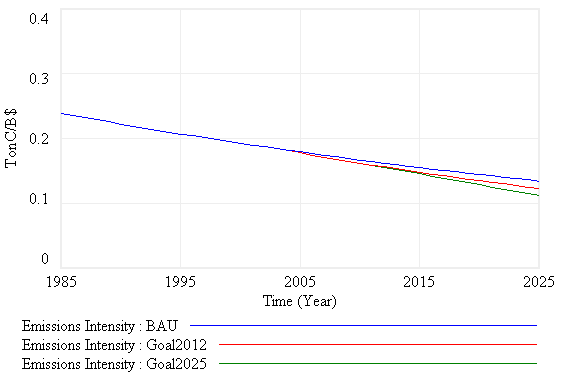
Several things are notable:
- The new goal is nearly identical to the 2002 goal until at least 2015.
- To replicate the schematic qualitatively, the 2002 goal simulation required an instantaneous change in the intensity reduction rate, which is not possible without painful short-term price induced substitution, because delays in capital turnover and technology development cause gradual transitions.
- 70% of the emissions intensity reduction between 2002 and 2025 is due to business-as-usual change, not policy (though it is dangerous to assume business-as-usual).
- None of the trajectories even remotely approaches Kyoto levels (<1500 MTonC/year) or atmospheric stabilization (<<750 MTonC/year, assuming the world follows).
*Update Looking at the White House fact sheet, it appears that the administration does now consider the reversal trajectory in its earlier schematic,
The growth in emissions will slow over the next decade, stop by 2025, and begin to reverse thereafter, so long as technology continues to advance.
According to Bush’s speech, the burden of the reversal falls particularly heavily on electric utilities:
… we’ve got to do more in the power generation sector. To reach our 2025 goal, we’ll need to more rapidly slow the growth of power sector greenhouse gas emissions so they peak within 10 to 15 years, and decline thereafter.