
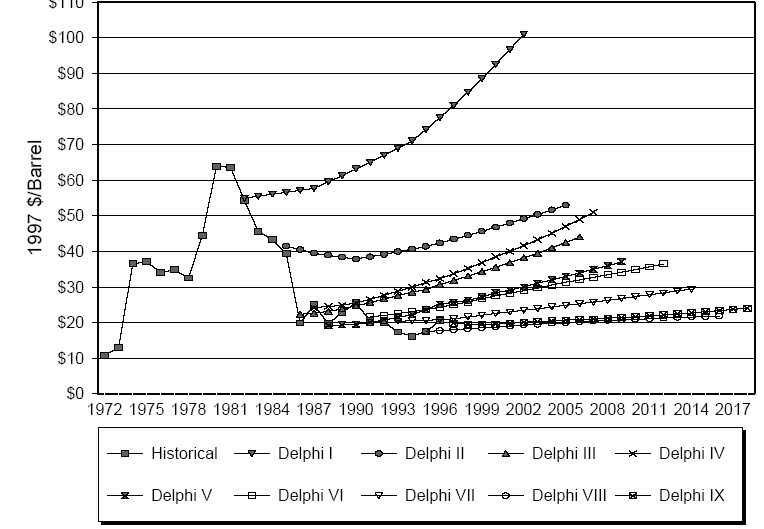
The history of long term energy forecasting is a rather mixed bag. Supply and demand forecasts have generally been half decent, in terms of percent error, but that’s primarily because GDP growth is steady, energy intensity is price-inelastic, and there’s a lot of momentum in energy consuming and producing capital. Energy price forecasts, on the other hand, have generally been terrible. Consider the Delphi panel forecasts conducted by the CEC:
In 1988, John Sterman showed that energy forecasts, even those using sophisticated models, were well represented by a simple adaptive rule:
Since 1973 forecasts of future energy consumption in the United States have fallen dramatically. Forecasts of consumption in 1985 made as recently as 1974 were too high by nearly a factor of two. Forecasts of consumption in 2000 have fallen by a similar ratio. The large errors raise questions about the forecasting methods used. This paper tests the ability of adaptive expectations and univariate trend extrapolation to explain the history of energy demand forecasts. A behavioral model of the trend estimation and forecasting process is developed. Energy demand is forecast by extrapolation of the expected growth rate of consumption. The expected growth rate is determined by the past rate of growth of actual energy consumption. The model explicitly considers delays in the measurement of energy consumption and in individual and organizational response to changes in the apparent trend. The model is shown to fit the forecast data well for three different forecast horizons. Adaptive trend extrapolation thus accounts well for significant evolution of energy demand forecasts during a major period of change in energy consumption. The results are reconciled with the fact that many of the forecasts in the sample were based on complex models and do not appear to be simple extrapolations, and implications for behavioral modeling of expectation formation are discussed.
(STERMAN, J. D. (1988) Modeling the Formation of Expectations: The History of Energy Demand Forecasts. International Journal of Forecasting, 4, 243-259.)
Now that modelers have been through a major price cycle, and modeling technology is 2 decades further along, has anything changed? SRES output suggests not. For another data point, I took a look at the Annual Energy Outlook, produced by the DOE’s Energy Information Administration, host to a wealth of data. I didn’t choose the AEO to pick on EIA; in fact, EIA should be congratulated as one of only a few sources that routinely practice the good habit of retrospective forecast evaluation. I supplemented the EIA’s retrospective with the 2008 AEO early release, the 2007 AEO, and a few other years, in order to illustrate how long run projections have changed. (Note that the EIA retrospective is in nominal $ terms, so I had to cast the data back to real terms using the US budget GDP deflator, which is not entirely accurate for future dates because the AEO studies may have assumed different inflation rates).
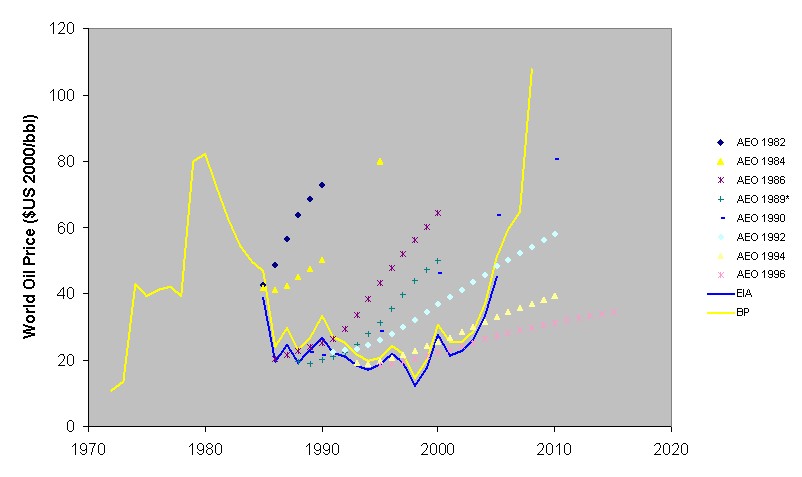
First, AEO forecasts (points) from ’82 to ’96, corresponding with the Delphi forecasts above, on roughly similar scales. Look familiar? Solid lines are real crude price data, from EIA and the BP Statistical Review.
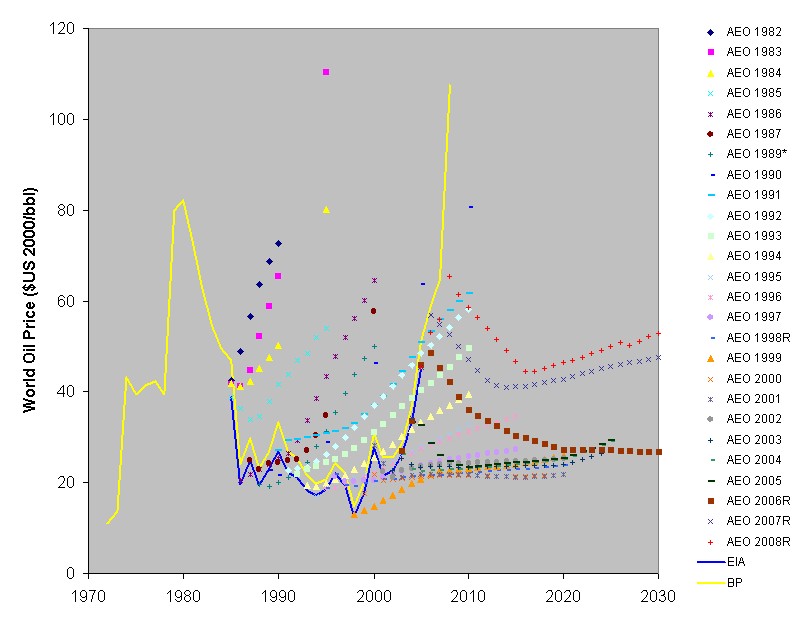
Next, the full suite of AEO forecasts. There are some interesting consistencies. Forecasts in the early ’80s imply that falling oil prices are temporary, soon to be replaced with further rises. Forecasts in the late ’80s and early ’90s indicate stable prices for some time, followed by a resumption of rapid escalation (perhaps they were just a little before their time). By the late ’90s, forecasts indicate that $20/bbl oil is here to stay. The 2006 forecast is particularly striking – it expects reversion of prices from prevailing $50/bbl oil to the $20/bbl range, with no upward trend in 2030 (surprising, given that elsewhere EIA describes a conventional oil peak as early as 2026). The 2007 and 2008 forecasts are less optimistic, with prices reverting to the $40-50/bbl, with some long term appreciation.
It’s unfair to evaluate forecasts without considering confidence intervals, because the best guess will always be wrong to some degree. It’s also fair to point out that a forecast without some indication of uncertainty is at best useless and at worst dangerous. The AEO doesn’t report formal confidence intervals, but it does bracket the reference case with high and low oil price scenarios. For 1998 and 2007, those look like the following:
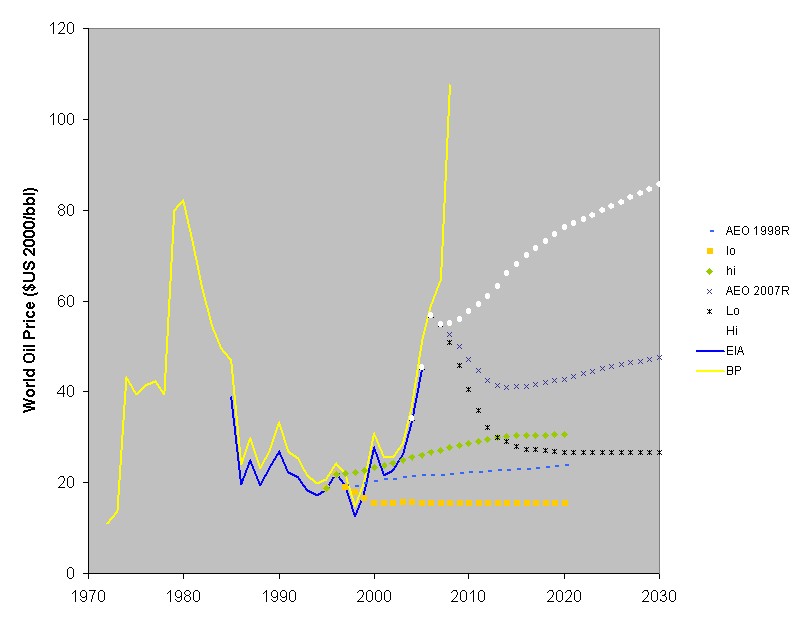
If you interpret the high and low price scenarios as confidence bounds, it’s clear that they are overconfident. This seems particularly true for the 1998 forecast; to observe the history of the ’73 and ’79 price spikes, and state with any confidence that such conditions will not recur requires near-heroic belief in a stable production environment. The 2007 scenarios explore a much wider territory, but were nevertheless quickly violated.
2 thoughts on “More Oil Price Forecasts”