Diagrams vs. Models

Following Bill Harris’ comment on Are causal loop diagrams useful? I went looking for Coyle’s hybrid influence diagrams. I didn’t find them, but instead ran across this interesting conversation in the SDR:

The tradition, one might call it the orthodoxy, in system dynamics is that a problem can only be analysed, and policy guidance given, through the aegis of a fully quantified model. In the last 15 years, however, a number of purely qualitative models have been described, and have been criticised, in the literature. This article briefly reviews that debate and then discusses some of the problems and risks sometimes involved in quantification. Those problems are exemplified by an analysis of a particular model, which turns out to bear little relation to the real problem it purported to analyse. Some qualitative models are then reviewed to show that they can, indeed, lead to policy insights and five roles for qualitative models are identified. Finally, a research agenda is proposed to determine the wise balance between qualitative and quantitative models.

… In none of this work was it stated or implied that dynamic behaviour can reliably be inferred from a complex diagram; it has simply been argued that describing a system is, in itself, a useful thing to do and may lead to better understanding of the problem in question. It has, on the other hand, been implied that, in some cases, quantification might be fraught with so many uncertainties that the model’s outputs could be so misleading that the policy inferences drawn from them might be illusory. The research issue is whether or not there are circumstances in which the uncertainties of simulation may be so large that the results are seriously misleading to the analyst and the client. … This stream of work has attracted some adverse comment. Lane has gone so far as to assert that system dynamics without quantified simulation is an oxymoron and has called it ‘system dynamics lite (sic)’. …

Coyle (2000) Qualitative and quantitative modelling in system dynamics: some research questions

Jack Homer and Rogelio Oliva aren’t buying it:

Geoff Coyle has recently posed the question as to whether or not there may be situations in which computer simulation adds no value beyond that gained from qualitative causal-loop mapping. We argue that simulation nearly always adds value, even in the face of significant uncertainties about data and the formulation of soft variables. This value derives from the fact that simulation models are formally testable, making it possible to draw behavioral and policy inferences reliably through simulation in a way that is rarely possible with maps alone. Even in those cases in which the uncertainties are too great to reach firm conclusions from a model, simulation can provide value by indicating which pieces of information would be required in order to make firm conclusions possible. Though qualitative mapping is useful for describing a problem situation and its possible causes and solutions, the added value of simulation modeling suggests that it should be used for dynamic analysis whenever the stakes are significant and time and budget permit.

Homer & Oliva (2001) Maps and models in system dynamics: a response to Coyle

Coyle rejoins:

This rejoinder clarifies that there is significant agreement between my position and that of Homer and Oliva as elaborated in their response. Where we differ is largely to the extent that quantification offers worthwhile benefit over and above analysis from qualitative analysis (diagrams and discourse) alone. Quantification may indeed offer potential value in many cases, though even here it may not actually represent ‘‘value for money’’. However, even more concerning is that in other cases the risks associated with attempting to quantify multiple and poorly understood soft relationships are likely to outweigh whatever potential benefit there might be. To support these propositions I add further citations to published work that recount effective qualitative-only based studies, and I offer a further real-world example where any attempts to quantify ‘‘multiple softness’’ could have lead to confusion rather than enlightenment. My proposition remains that this is an issue that deserves real research to test the positions of Homer and Oliva, myself, and no doubt others, which are at this stage largely based on personal experiences and anecdotal evidence.

Coyle (2001) Rejoinder to Homer and Oliva

My take: I agree with Coyle that qualitative models can often lead to insight. However, I don’t buy the argument that the risks of quantification of poorly understood soft variables exceeds the benefits. First, if the variables in question are really too squishy to get a grip on, that part of the modeling effort will fail. Even so, the modeler will have some other working pieces that are more physical or certain, providing insight into the context in which the soft variables operate. Second, as long as the modeler is doing things right, which means spending ample effort on validation and sensitivity analysis, the danger of dodgy quantification will reveal itself as large uncertainties in behavior subject to the assumptions in question. Third, the mere attempt  to quantify the qualitative is likely to yield some insight into the uncertain variables, which exceeds that derived from the purely qualitative approach. In fact, I would argue that the greater danger lies in the qualitative approach, because it is quite likely that plausible-looking constructs on a diagram will go unchallenged, yet harbor deep conceptual problems that would be revealed by modeling.

I see this as a cost-benefit question. With infinite resources, a model always beats a diagram. The trouble is that in many cases time, money and the will of participants are in short supply, or can’t be justified given the small scale of a problem. Often in those cases a qualitative approach is justified, and diagramming or other elicitation of structure is likely to yield a better outcome than pure talk. Also, where resources are limited, an overzealous modeling attempt could lead to narrow focus, overemphasis on easily quantifiable concepts, and implementation failure due to too much model and not enough process. If there’s a risk to modeling, that’s it – but that’s a risk of bad modeling, and there are many of those.

Are causal loop diagrams useful?

Reflecting on the Afghanistan counterinsurgency diagram in the NYTimes, Scott Johnson asked me whether I found causal loop diagrams (CLDs) to be useful. Some system dynamics hardliners don’t like them, and others use them routinely.

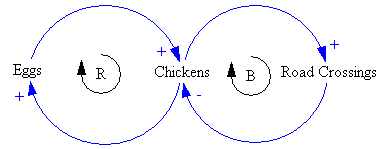
Here’s a CLD:

Chicken CLD

And here’s it’s stock-flow sibling:

Chicken Stock Flow

My bottom line is:

  • CLDs are very useful, if developed and presented with a little care.
  • It’s often clearer to use a hybrid diagram that includes stock-flow “main chains”. However, that also involves a higher burden of explanation of the visual language.
  • You can get into a lot of trouble if you try to mentally simulate the dynamics of a complex CLD, because they’re so underspecified (but you might be better off than talking, or making lists).
  • You’re more likely to know what you’re talking about if you go through the process of building a model.
  • A big, messy picture of a whole problem space can be a nice complement to a focused, high quality model.

Here’s why:

Continue reading “Are causal loop diagrams useful?”

Visualizing biological time

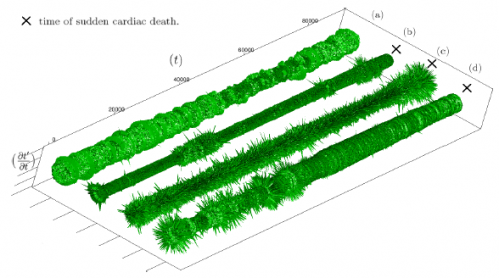
A new paper on arXiv shows an interesting approach to visualizing time in systems with circadian or other rhythms. I haven’t figured out if it’s useful for oscillatory dynamic systems more generally, but it makes some neat visuals:

scheme

The method makes it possible to see changes in behavior in time series with waaay to many oscillations to explore on a normal 2D time-value plot:

cardiac

Read more on arXiv.

Hypnotizing chickens, Afghan insurgents, and spaghetti

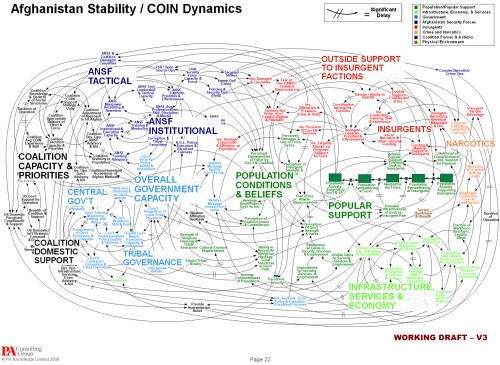
The NYT is about 4 months behind the times picking up on a spaghetti diagram of Afghanistan situation, which it uses to lead off a critique of Powerpoint use in the military. The reporter is evidently cheesed off at being treated like a chicken:

Senior officers say the program does come in handy when the goal is not imparting information, as in briefings for reporters.

The news media sessions often last 25 minutes, with 5 minutes left at the end for questions from anyone still awake. Those types of PowerPoint presentations, Dr. Hammes said, are known as “hypnotizing chickens.”

Afghanistan Stability: COIN (Counterinsurgency) Model
Click to enlarge

The Times reporter seems unaware of the irony of her own article. Early on, she quotes a general, “Some problems in the world are not bullet-izable.” But isn’t the spaghetti diagram an explicit attempt to get away from bullets, and present a rich, holistic picture of a complicated problem? The underlying point – that presentations are frequently awful and waste time – is well taken, but hardly news. If there’s a problem here, it’s not the fault of Powerpoint, and we’d do well to identify the real issue.

For those unfamiliar with the lingo, the spaghetti is actually a Causal Loop Diagram (CLD), a type of influence diagram. It’s actually a hybrid, because the Popular Support sector also has a stock-flow chain. Between practitioners, a good CLD can be an incredibly efficient communication device – much more so than the “five-pager” cited in the article. CLDs occupy a niche between formal mathematical models and informal communication (prose or ppt bullets). They’re extremely useful for brainstorming (which is what seems to have been going on here) and for communicating selected feedback insights from a formal model. They also tend to leave a lot to the imagination – if you try to implement a CLD in equations, you’ll discover many unstated assumptions and inconsistencies along the way. Still, the CLD is likely to be far more revealing of the tangle of assumptions that lie in someone’s head than a text document or conversation.

Evidently the Times has no prescription for improvement, but here’s mine:

  • If the presenters were serious about communicating with this diagram, they should have spent time introducing the CLD lingo and walking through the relationships. That could take a long time, i.e. a whole presentation could be devoted to the one slide. Also, the diagram should have been built up in digestible chunks, without overlapping links, and key feedback loops that lead to success or disaster should be identified.
  • If the audience were serious about understanding what’s going on, they shouldn’t shut off their brains and snicker when unconventional presentations appear. If reporters stick their fingers in their ears and mumble “not listening … not listening … not listening …” at the first sign of complexity, it’s no wonder DoD treats them like chickens.

Faking fitness

Geoffrey Miller wonders why we haven’t met aliens. I think his proposed answer has a lot to do with the state of the world and why it’s hard to sell good modeling.

I don’t know why this 2006 Seed article bubbled to the top of my reader, but here’s an excerpt:

The story goes like this: Sometime in the 1940s, Enrico Fermi was talking about the possibility of extraterrestrial intelligence with some other physicists. … Fermi listened patiently, then asked, simply, “So, where is everybody?” That is, if extraterrestrial intelligence is common, why haven’t we met any bright aliens yet? This conundrum became known as Fermi’s Paradox.

It looks, then, as if we can answer Fermi in two ways. Perhaps our current science over-estimates the likelihood of extraterrestrial intelligence evolving. Or, perhaps evolved technical intelligence has some deep tendency to be self-limiting, even self-exterminating. …

I suggest a different, even darker solution to the Paradox. Basically, I think the aliens don’t blow themselves up; they just get addicted to computer games. They forget to send radio signals or colonize space because they’re too busy with runaway consumerism and virtual-reality narcissism. …

The fundamental problem is that an evolved mind must pay attention to indirect cues of biological fitness, rather than tracking fitness itself. This was a key insight of evolutionary psychology in the early 1990s; although evolution favors brains that tend to maximize fitness (as measured by numbers of great-grandkids), no brain has capacity enough to do so under every possible circumstance. … As a result, brains must evolve short-cuts: fitness-promoting tricks, cons, recipes and heuristics that work, on average, under ancestrally normal conditions.

The result is that we don’t seek reproductive success directly; we seek tasty foods that have tended to promote survival, and luscious mates who have tended to produce bright, healthy babies. … Technology is fairly good at controlling external reality to promote real biological fitness, but it’s even better at delivering fake fitness—subjective cues of survival and reproduction without the real-world effects.

Fitness-faking technology tends to evolve much faster than our psychological resistance to it.

… I suspect that a certain period of fitness-faking narcissism is inevitable after any intelligent life evolves. This is the Great Temptation for any technological species—to shape their subjective reality to provide the cues of survival and reproductive success without the substance. Most bright alien species probably go extinct gradually, allocating more time and resources to their pleasures, and less to their children. They eventually die out when the game behind all games—the Game of Life—says “Game Over; you are out of lives and you forgot to reproduce.”

I think the shorter version might be,

The secret of life is honesty and fair dealing… if you can fake that, you’ve got it made. – Attributed to Groucho Marx

The general problem for corporations and countries is that there’s a big problem attributing success to individuals. People rise in power, prestige and wealth by creating the impression of fitness, rather than creating any actual fitness, as long as there are large stocks that separate action and result in time and space and causality remains unclear. That means that there are two paths to oblivion. Miller’s descent into a self-referential virtual reality could be one. More likely, I think, is sinking into a self-deluded reality that erodes key resource stocks, until catastrophe follows – nukes optional.

The antidote for the attribution problem is good predictive modeling. The trouble is, the truth isn’t selling very well. I suspect that’s partly because we have less of it than we typically think. More importantly, though, leaders who succeeded on BS and propaganda are threatened by real predictive power. The ultimate challenge for humanity, then, is to figure out how to make insight about complex systems evolutionarily successful.

Hell freezes over: Fox to go carbon neutral

I keep checking, but today is not April 1st:

In the Fox News universe, the world is definitely not warming. Quite the opposite: Climate change is “bunk,” a spectacular hoax perpetrated on the rest of us by a cabal of corrupt scientists. But while embracing climate skepticism may be good for ratings, the execs at Fox News’ parent company, News Corp., don’t see it as good for the long-term bottom line. By the end of this year, News Corp. aims to go carbon neutral — meaning that the home of über-global warming denialists like Sean Hannity and Glenn Beck may soon be one of the greener multinational corporations around.

News Corp. announced its plan in May 2007 with a groundbreaking speech from chairman Rupert Murdoch. “Climate change poses clear, catastrophic threats,” declared Murdoch. “We may not agree on the extent, but we certainly can’t afford the risk of inaction.” Formerly skeptical about global warming, Murdoch was reportedly converted by a presentation from Al Gore — whom Fox News commentators have described as “nuts” and “off his lithium” — and by his green-leaning son James, who is expected to inherit his business empire.

But Murdoch wasn’t acting out of altruism. For News Corp., he said, the move was “simply good business.” (Fox News barely mentioned the boss’ remarks.)

Murdoch’s logic was that higher energy costs are inevitable, given coming carbon regulations and dwindling supplies of conventional fuels such as oil. So why not get ahead of the game? “Whatever [going carbon neutral] costs will be minimal compared to our overall revenues,” the media mogul has remarked, “and we’ll get that back many times over.”

Read More at Wired

Writing a good system dynamics paper II

It’s SD conference paper review time again. Last year I took notes while reviewing, in an attempt to capture the attributes of a good paper. A few additional thoughts:

  • No model is perfect, but it pays to ask yourself, will your model stand up to critique?
  • Model-data comparison is extremely valuable and too seldom done, but trivial tests are not interesting. Fit to data is a weak test of model validity; it’s often necessary, but never sufficient as a measure of quality. I’d much rather see the response of a model to a step input or an extreme conditions test than a model-data comparison. It’s too easy to match the model to the data with exogenous inputs, so unless I see a discussion of a multi-faceted approach to validation, I get suspicious. You might consider how your model meets the following criteria:
    • Do decision rules use information actually available to real agents in the system?
    • Would real decision makers agree with the decision rules attributed to them?
    • Does the model conserve energy, mass, people, money, and other physical quantities?
    • What happens to the behavior in extreme conditions?
    • Do physical quantities always have nonnegative values?
    • Do units balance?
  • If you have time series output, show it with graphs – it takes a lot of work to “see” the behavior in tables. On the other hand, tables can be great for other comparisons of outcomes.
  • If all of your graphs show constant values, linear increases (ramps), or exponentials, my eyes glaze over, unless you can make a compelling case that your model world is really that simple, or that people fail to appreciate the implications of those behaviors.
  • Relate behavior to structure. I don’t care what happens in scenarios unless I know why it happens. One effective way to do this is to run tests with and without certain feedback loops or sectors of the model active.
  • Discuss what lies beyond the boundary of your model. What did you leave out and why? How does this limit the applicability of the results?
  • If you explore a variety of scenarios with your model (as you should), introduce the discussion with some motivation, i.e. why are the particular scenarios tested important, realistic, etc.?
  • Take some time to clean up your model diagrams. Eliminate arrows that cross unnecessarily. Hide unimportant parameters. Use clear variable names.
  • It’s easiest to understand behavior in deterministic experiments, so I like to see those. But the real world is noisy and uncertain, so it’s also nice to see experiments with stochastic variation or Monte Carlo exploration of the parameter space. For example, there are typically many papers on water policy in the ENV thread. Water availability is contingent on precipitation, which is variable on many time scales. A system’s response to variation or extremes of precipitation is at least as important as its mean behavior.
  • Modeling aids understanding, which is intrinsically valuable, but usually the real endpoint of a modeling exercise is a decision or policy change. Sometimes, it’s enough to use the model to characterize a problem, after which the solution is obvious. More often, though, the model should be used to develop and test decision rules that solve the problem you set out to conquer. Show me some alternative strategies, discuss their limitations and advantages, and describe how they might be implemented in the real world.
  • If you say that an SD model can’t predict or forecast, be very careful. SD practitioners recognized early on that forecasting was often a fool’s errand, and that insight into behavior modes for design of robust policies was a worthier goal. However, SD is generally about building good dynamic models with appropriate representations of behavior and so forth, and good models are a prerequisite to good predictions. An SD model that’s well calibrated can forecast as well as any other method, and will likely perform better out of sample than pure statistical approaches. More importantly, experimentation with the model will reveal the limits of prediction.
  • It never hurts to look at your paper the way a reviewer will look at it.

WORLD3-03

This is the latest instance of the WORLD3 model, as in Limits to Growth – the 30 year update, from the standard Vensim distribution. It’s not much changed from the 1972 original used in Limits to Growth, which is documented in great detail in Dynamics of Growth in a Finite World (half off at Pegasus as of this moment).

There have been many critiques of this model, including the fairly famous Models of Doom. Many are ideological screeds that miss the point, and many modern critics do not appear to have read the book. The only good, comprehensive technical critique of World3 that I’m aware of is Wil Thissen’s thesis, Investigations into the Club of Rome’s WORLD3 model: lessons for understanding complicated models (Eindhoven, 1978). Portions appeared in IEEE Transactions.

My take on the more sensible critiques is that they show two things:

  • WORLD3 is an imperfect expression of the underlying ideas in Limits to Growth.
  • WORLD3 doesn’t have the policy space to capture competing viewpoints about the global situation; in particular it does not represent markets and technology as many see them.

It doesn’t necessarily follow from those facts that the underlying ideas of Limits are wrong. We still have to grapple with the consequences of exponential growth confronting finite planetary boundaries with long perception and action delays.

I’ve written some other material on limits here.

Files: WORLD3-03 (zipped archive of Vensim models and constant changes)

Another look at inadequate Copenhagen pledges

Joeri Rogelj and others argue that Copenhagen Accord pledges are paltry in a Nature Opinion,

Current national emissions targets can’t limit global warming to 2 °C, calculate Joeri Rogelj, Malte Meinshausen and colleagues — they might even lock the world into exceeding 3 °C warming.

  • Nations will probably meet only the lower ends of their emissions pledges in the absence of a binding international agreement
  • Nations can bank an estimated 12 gigatonnes of Co2 equivalents surplus allowances for use after 2012
  • Land-use rules are likely to result in further allowance increases of 0.5 GtCO2-eq per year
  • Global emissions in 2020 could thus be up to 20% higher than today
  • Current pledges mean a greater than 50% chance that warming will exceed 3°C by 2100
  • If nations agree to halve emissions by 2050, there is still a 50% chance that warming will exceed 2°C and will almost certainly exceed 1.5°C

Via Nature’s Climate Feedback, Copenhagen Accord – missing the mark.

Computer models running the EU? Eruptions, models, and clueless reporting

The EU airspace shutdown provides yet another example of ignorance of the role of models in policy:

Computer Models Ruining EU?

Flawed computer models may have exaggerated the effects of an Icelandic volcano eruption that has grounded tens of thousands of flights, stranded hundreds of thousands of passengers and cost businesses hundreds of millions of euros. The computer models that guided decisions to impose a no-fly zone across most of Europe in recent days are based on incomplete science and limited data, according to European officials. As a result, they may have over-stated the risks to the public, needlessly grounding flights and damaging businesses. “It is a black box in certain areas,” Matthias Ruete, the EU’s director-general for mobility and transport, said on Monday, noting that many of the assumptions in the computer models were not backed by scientific evidence. European authorities were not sure about scientific questions, such as what concentration of ash was hazardous for jet engines, or at what rate ash fell from the sky, Mr. Ruete said. “It’s one of the elements where, as far as I know, we’re not quite clear about it,” he admitted. He also noted that early results of the 40-odd test flights conducted over the weekend by European airlines, such as KLM and Air France, suggested that the risk was less than the computer models had indicated. – Financial Times

Other venues picked up similar stories:

Also under scrutiny last night was the role played by an eight-man team at the Volcanic Ash Advisory Centre at Britain’s Meteorological Office. The European Commission said the unit started the chain of events that led to the unprecedented airspace shutdown based on a computer model rather than actual scientific data. – National Post

These reports miss a number of crucial points:

  • The decision to shut down the airspace was political, not scientific. Surely the Met Office team had input, but not the final word, and model results were only one input to the decision.
  • The distinction between computer models and “actual scientific data” is false. All measurements involve some kind of implicit model, required to interpret the result. The 40 test flights are meaningless without some statistical interpretation of sample size and so forth.
  • It’s not uncommon for models to demonstrate that data are wrong or misinterpreted.
  • The fact that every relationship or parameter in a model can’t be backed up with a particular measurement does not mean that the model is unscientific.
    • Numerical measurements are not the only valid source of data; there are also laws of physics, and a subject matter expert’s guess is likely to be better than a politician’s.
    • Calibration of the aggregate result of a model provides indirect measurement of uncertain components.
    • Feedback structure may render some parameters insensitive and therefore unimportant.
  • Good decisions sometimes lead to bad outcomes.

The reporters, and maybe also the director-general (covering his you-know-what), have neatly shifted blame, turning a problem in decision making under uncertainty into an anti-science witch hunt. What alternative to models do they suggest? Intuition? Prayer? Models are just a way of integrating knowledge in a formal, testable, shareable way. Sure, there are bad models, but unlike other bad ideas, it’s at least easy to identify their problems.

Thanks to Jack Dirmann, Green Technology for the tip.