Return of the Afghan spaghetti

The Afghanistan counterinsurgency causal loop diagram makes another appearance in this TED talk, in which Eric Berlow shows the hypnotized chickens the light:
https://www.ted.com/talks/eric_berlow_simplifying_complexity/transcript?language=en

I’m of two minds about this talk. I love that it embraces complexity rather than reacting with the knee-jerk “eeewww … gross” espoused by so many NYT commenters. The network view of the system highlights some interesting relationships, particularly when colored by the flavor of each sphere (military, ethnic, religious … ). Also, the generic categorization of variables that are actionable (unlike terrain) is useful. The insights from ecosystem simplification are potentially quite interesting, though we really only get a tantalizing hint at what might lie beneath.

However, I think the fundamental analogy between the system CLD and a food web or other network may only partially hold. That means that the insight, that influence typically lies within a few degrees of connectivity of the concept of interest, may not be generalizable. Generically, a dynamic model is a network of gains among state variables, and there are perhaps some reasons to think that, due to signal attenuation and so forth, that most influences are local. However, there are some important differences between the Afghan CLD and typical network diagrams.

In a food web, the nodes are all similar agents (species) which have a few generic relationships (eat or be eaten) with associated flows of information or resources. In a CLD, the nodes are a varied mix of agents, concepts, and resources. As a result, their interactions may differ wildly: the interaction between “relative popularity of insurgents” and “funding for insurgents” (from the diagram) is qualitatively different from that between “targeted strikes” and “perceived damages.” I suspect that in many models, the important behavior modes are driven by dynamics that span most of the diagram or model. That may be deliberate, because we’d like to construct models that describe a dynamic hypothesis, without a lot of extraneous material.

Probably the best way to confirm or deny my hypothesis would be to look at eigenvalue analysis of existing models. I don’t have time to dig into this, but Kampmann & Oliva’s analysis of Mass’ economic model is an interesting case study. In that model, the dominant structures responsible for oscillatory modes in the economy are a real mixed bag, with important contributions from both short and longish loops.

This bears further thought … please share yours, especially if you have a chance to look at Berlow’s PNAS article on food webs.

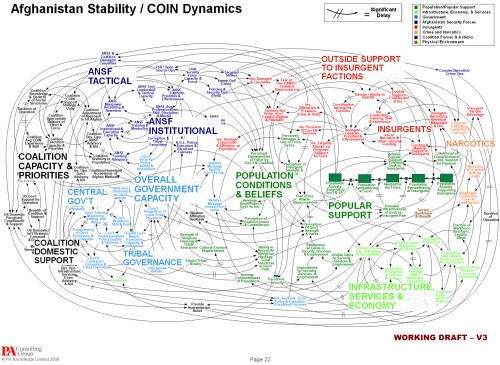
Hypnotizing chickens, Afghan insurgents, and spaghetti

The NYT is about 4 months behind the times picking up on a spaghetti diagram of Afghanistan situation, which it uses to lead off a critique of Powerpoint use in the military. The reporter is evidently cheesed off at being treated like a chicken:

Senior officers say the program does come in handy when the goal is not imparting information, as in briefings for reporters.

The news media sessions often last 25 minutes, with 5 minutes left at the end for questions from anyone still awake. Those types of PowerPoint presentations, Dr. Hammes said, are known as “hypnotizing chickens.”

Afghanistan Stability: COIN (Counterinsurgency) Model
Click to enlarge

The Times reporter seems unaware of the irony of her own article. Early on, she quotes a general, “Some problems in the world are not bullet-izable.” But isn’t the spaghetti diagram an explicit attempt to get away from bullets, and present a rich, holistic picture of a complicated problem? The underlying point – that presentations are frequently awful and waste time – is well taken, but hardly news. If there’s a problem here, it’s not the fault of Powerpoint, and we’d do well to identify the real issue.

For those unfamiliar with the lingo, the spaghetti is actually a Causal Loop Diagram (CLD), a type of influence diagram. It’s actually a hybrid, because the Popular Support sector also has a stock-flow chain. Between practitioners, a good CLD can be an incredibly efficient communication device – much more so than the “five-pager” cited in the article. CLDs occupy a niche between formal mathematical models and informal communication (prose or ppt bullets). They’re extremely useful for brainstorming (which is what seems to have been going on here) and for communicating selected feedback insights from a formal model. They also tend to leave a lot to the imagination – if you try to implement a CLD in equations, you’ll discover many unstated assumptions and inconsistencies along the way. Still, the CLD is likely to be far more revealing of the tangle of assumptions that lie in someone’s head than a text document or conversation.

Evidently the Times has no prescription for improvement, but here’s mine:

  • If the presenters were serious about communicating with this diagram, they should have spent time introducing the CLD lingo and walking through the relationships. That could take a long time, i.e. a whole presentation could be devoted to the one slide. Also, the diagram should have been built up in digestible chunks, without overlapping links, and key feedback loops that lead to success or disaster should be identified.
  • If the audience were serious about understanding what’s going on, they shouldn’t shut off their brains and snicker when unconventional presentations appear. If reporters stick their fingers in their ears and mumble “not listening … not listening … not listening …” at the first sign of complexity, it’s no wonder DoD treats them like chickens.