Doing quality simulation research

Unless the Journal of Irreproducible Results is your target, you should check out this paper:

Rahmandad, H., Sterman J., (forthcoming). Reporting Guidelines for Simulation-based Research in Social Sciences

Abstract: Reproducibility of research is critical for the healthy growth and accumulation of reliable knowledge, and simulation-based research is no exception. However, studies show many simulation-based studies in the social sciences are not reproducible. Better standards for documenting simulation models and reporting results are needed to enhance the reproducibility of simulation-based research in the social sciences. We provide an initial set of Reporting Guidelines for Simulation-based Research (RGSR) in the social sciences, with a focus on common scenarios in system dynamics research. We discuss these guidelines separately for reporting models, reporting simulation experiments, and reporting optimization results. The guidelines are further divided into minimum and preferred requirements, distinguishing between factors that are indispensable for reproduction of research and those that enhance transparency. We also provide a few guidelines for improved visualization of research to reduce the costs of reproduction. Suggestions for enhancing the adoption of these guidelines are discussed at the end.

I should add that this advice isn’t just for the social sciences, nor just for research. Business and public policy models developed by consultants should be no less replicable, even if they remain secret. This is not only a matter of intellectual honesty; it’s a matter of productivity (documented components are easier to reuse) and learning (if you don’t keep track of what you do, you can’t identify and learn from mistakes when reality evolves away from your predictions).

This reminds me that I forgot to plug my annual advice on good writing for the SD conference:

I’m happy to report that the quality of papers in the thread I see was higher than usual (or at least the variance was lower – no plenary blockbuster, but also no dreadful, innumerate, ungrammatical horrors to wade through).


The vicious cycle of ignorance

XKCD:

XKCD - Forgot Algebra

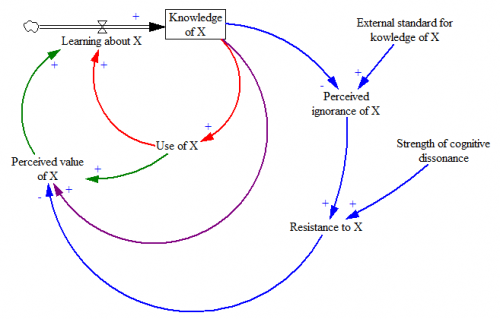
Here’s my quick take on the feedback structure behind this:

Knowledge of X (with X = algebra, cooking, …) is at the heart of a nest of positive feedback loops that make learning about X subject to vicious or virtuous cycles.

  • The more you know about X, the more you find opportunities to use it, and vice versa. If you don’t know calculus, you tend to self-select out of engineering careers, thus fulfilling the “I’ll never use it” prophecy. Through use, you learn by doing, and gain further knowledge.
  • Similarly, the more use you get out of X, the more you perceive it as valuable, and the more motivated you are to learn about it.
  • When you know more, you also may develop intrinsic interest or pride of craft in the topic.
  • When you confront some external standard for knowledge, and find yourself falling short, cognitive dissonance can kick in. Rather than thinking, “I really ought to up my game a bit,” you think, “algebra is for dorks, and those pointy-headed scientists are just trying to seize power over us working stiffs.”

I’m sure this could be improved on, for example by recognizing that attitudes are a stock.

Still, it’s easy to see here how algebra education goes wrong. In school, the red and green loops are weak, because there’s typically no motivating application more compelling than a word problem. Instead, there’s a lot of reliance on external standards (grades and testing), which encourages resistance.

A possible remedy therefore is to drive education with real-world projects, so that algebra emerges as a tool with an obvious need, emphasizing the red and green loops over the blue. An interesting real-world project might be self-examination of the role of the blue loop in our lives.


Bathtub Statistics

The pitfalls of pattern matching don’t just apply to intuitive comparisons of the behavior of associated stocks and flows. They also apply to statistics. This means, for example, that a linear regression like

stock = a + b*flow + c*time + error

is likely to go seriously wrong. That doesn’t stop such things from sneaking into the peer reviewed literature though. A more common quasi-statistical error is to take two things that might be related, measure their linear trends, and declare the relationship falsified if the trends don’t match. This bogus reasoning remains a popular pastime of climate skeptics, who ask, how could temperature go down during some period when emissions went up? (See this example.) This kind of naive naive statistical reasoning, with static mental models of dynamic phenomena, is hardly limited to climate skeptics though.

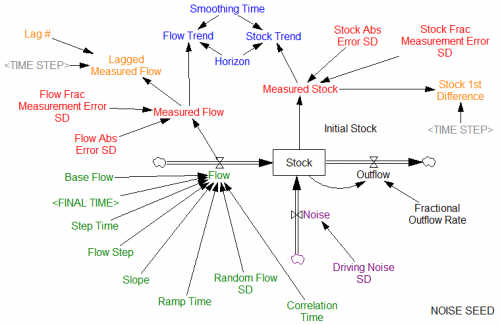
Given the dynamics, it’s actually quite easy to see how such things can occur. Here’s a more complete example of a realistic situation:

At the core, we have the same flow driving a stock. The flow is determined by a variety of test inputs , so we’re still not worrying about circular causality between the stock and flow. There is potentially feedback from the stock to an outflow, though this is not active by default. The stock is also subject to other random influences, with a standard deviation given by Driving Noise SD. We can’t necessarily observe the stock and flow directly; our observations are subject to measurement error. For purposes that will become evident momentarily, we might perform some simple manipulations of our measurements, like lagging and differencing. We can also measure trends of the stock and flow. Note that this still simplifies reality a bit, in that the flow measurement is instantaneous, rather than requiring its own integration process as physics demands. There are no complications like missing data or unequal measurement intervals.

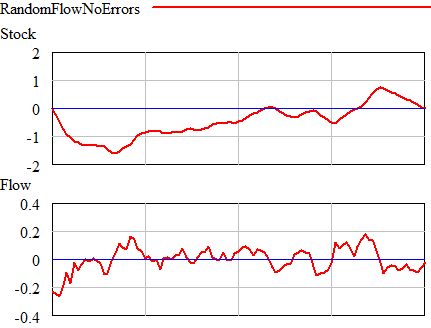
Now for an experiment. First, suppose that the flow is random (pink noise) and there are no measurement errors, driving noise, or outflows. In that case, you see this:

Once could actually draw some superstitious conclusions about the stock and flow time series above by breaking them into apparent episodes, but that’s quite likely to mislead unless you’re thinking explicitly about the bathtub. Looking at a stock-flow scatter plot, it appears that there is no relationship:
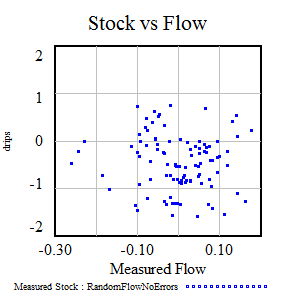
Of course, we know this is wrong because we built the model with perfect Flow->Stock causality. The usual statistical trick to reveal the relationship is to undo the integration by taking the first difference of the stock data. When you do that, plotting the change in the stock vs. the flow (lagged one period to account for the differencing), the relationship reappears: Continue reading “Bathtub Statistics”

Bathtub Dynamics

Failure to account for bathtub dynamics is a basic misperception of system structure, that occurs even in simple systems that lack feedback. Research shows that pattern matching, a common heuristic, leads even highly educated people to draw incorrect conclusions about systems as simple as the entry and exit of people in a store.

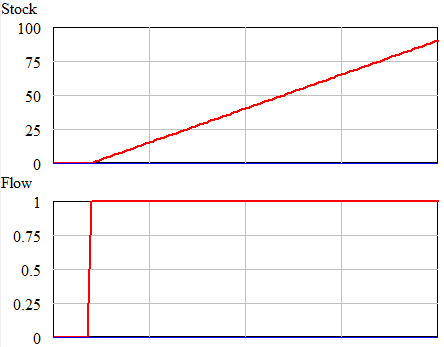
This can occur in any stock-flow system, which means that it’s ubiquitous. Here’s the basic setup:

Replace “Flow” and “Stock” with your favorite concepts – income and bank balance, sales rate and installed base, births and rabbits, etc. Obviously the flow causes the stock – by definition, the flow rate is the rate of change of the stock level. There is no feedback here; just pure integration, i.e. the stock accumulates the flow.

The pattern matching heuristic attempts to detect causality, or make predictions about the future, by matching the temporal patterns of cause and effect. So, naively, a pattern matcher expects to see a step in the stock in response to a step in the flow. But that’s not what happens:

Pattern matching fails because we shouldn’t expect the patterns to match through an integration. Above, the integral of the step ( flow = constant ) is a ramp ( stock = constant * time ). Other patterns are possible. For example, a monotonically decreasing cause (flow) can yield an increasing effect (stock), or even nonmonotonic behavior if it crosses zero: Continue reading “Bathtub Dynamics”