
Larry Yeager and I submitted a paper to the SD conference, proposing dynamic cohorts as a new way to model aging populations, vehicle fleets, and other quantities. Cohorts aren’t new*, of course, but Ventity makes it practical to allocate them on demand, so you don’t waste computation and attention on a lot of inactive zeroes.
The traditional alternative has been aging chains. Setting aside technical issues like dispersion, I think there’s a basic conceptual problem with aging chains: they aren’t a natural, intuitive operational representation of what’s happening in a system. Here’s why.
Consider a model of an individual. You’d probably model age like this:
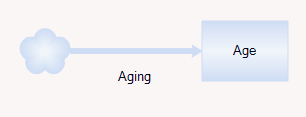
Here, age is a state of the individual that increases with aging. Simple. Equivalently, you could calculate it from the individual’s birth date:

Ideally, a model of a population would preserve the simplicity of the model of the individual. But that’s not what the aging chain does:

This says that, as individuals age, they flow from one stock to another. But there’s no equivalent physical process for that. People don’t flow anywhere on their birthday. Age is continuous, but the separate stocks here represent an arbitrary discretization of age.
Even worse, if there’s mortality, the transition time from age x to age x+1 (the taus on the diagram above) is not precisely one year.
You can contrast this with most categorical attributes of an individual or population:
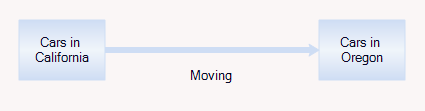
When cars change (geographic) state, the flow represents an actual, physical movement across a boundary, which seems a lot more intuitive.
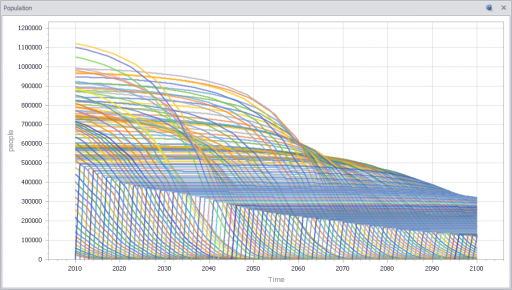
As we’ll show in the forthcoming paper, dynamic cohorts provide a more natural link between models of individuals and groups, and make it easy to see the lifecycle of a set of related entities. Here are the population sizes of annual cohorts for Japan:
I’ll link the paper here when it’s available.
* This was one of the applications we proposed in the original Ventity white paper, and others have arrived at the same idea, minus the dynamic allocation of the cohorts. Demographers have been doing it this way for ages, though usually in statistical approaches with no visual representation of the system.