
Ten years ago, I explored future climate analogs for my location in Montana:
When things really warm up, to +9 degrees F (not at all implausible in the long run), 16 of the top 20 analogs are in CO and UT, …
Looking at a lot of these future climate analogs on Google Earth, their common denominator appears to be rattlesnakes. I’m sure they’re all nice places in their own way, but I’m worried about my trees. I’ll continue to hope that my back-of-the-envelope analysis is wrong, but in the meantime I’m going to hedge by managing the forest to prepare for change.
I think there’s a lot more to worry about than trees. Fire, wildlife, orchids, snowpack, water availability, …
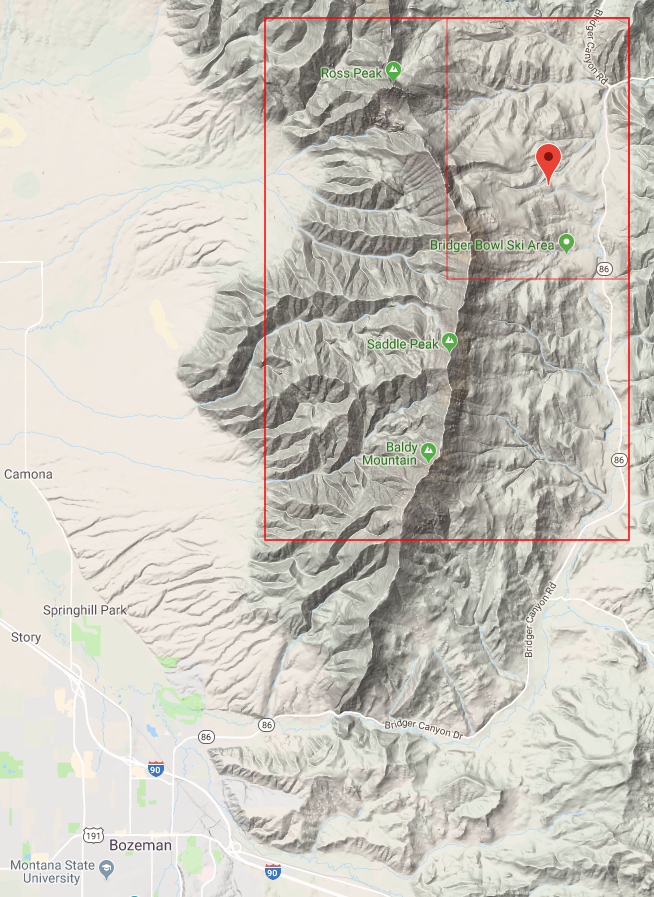
Recently I decided to take another look, partly inspired by the Bureau of Reclamation’s publication of downscaled data. This solves some of the bias correction issues I had in 2008. I grabbed the model output (36 runs from CMIP5) and observations for the 1/8 degree gridpoint containing Bridger Bowl:
Then I used Vensim to do a little data processing, converting the daily time series (which are extremely noisy weather) into 10-year moving averages (i.e., climate).
Business-As-Usual
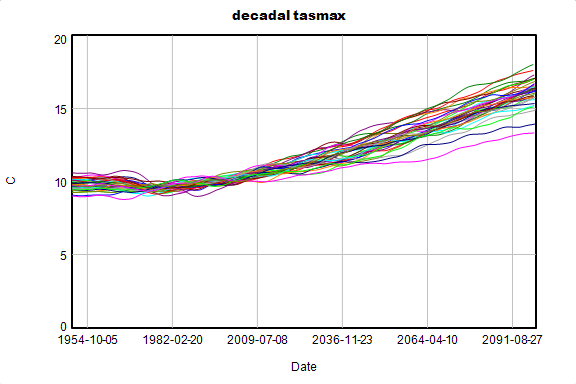
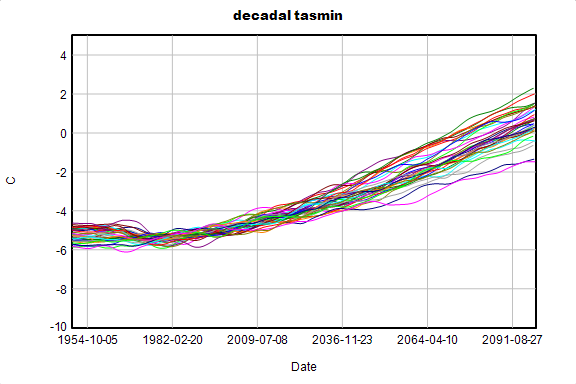
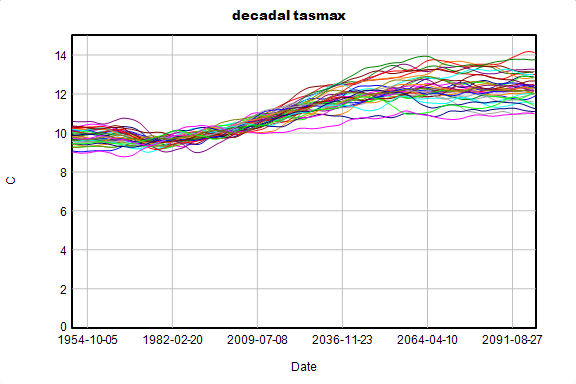
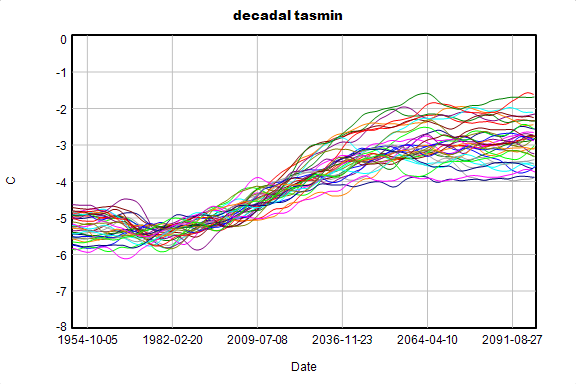
First, the bad news. For business-as-usual greenhouse gas emissions (the RCP85 scenario), temperatures rise dramatically, by about 5 degrees C (+9 Fahrenheit) from the present. The takeoff point is around 2010, so if you think you’ve already seen some climate change, you ain’t seen nothin’ yet. (If you think you haven’t seen some climate change, you’ve either moved recently, or you don’t go outside much.)
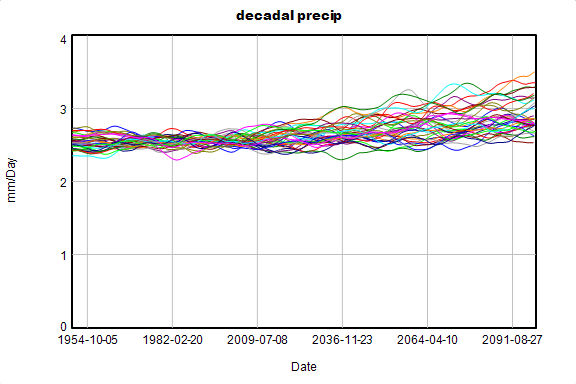
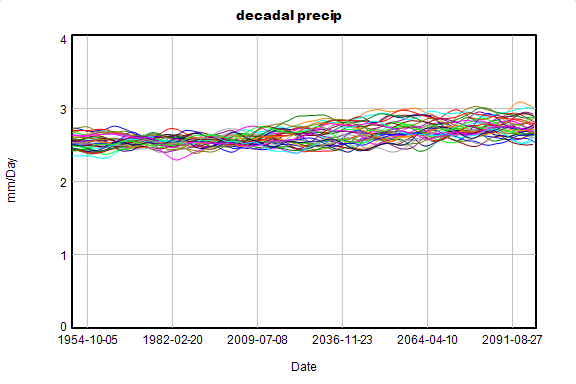
Precipitation increases along with temperature. This is expected, because rising temperature increases the water vapor content of the atmosphere, essentially accelerating the whole hydrologic cycle. However, it’s not clear that the soil moisture available to plants increases in proportion to precipitation, because evaporation also increases. Note also that most of the high-precipitation scenarios are due to a single model with multiple runs in the ensemble.
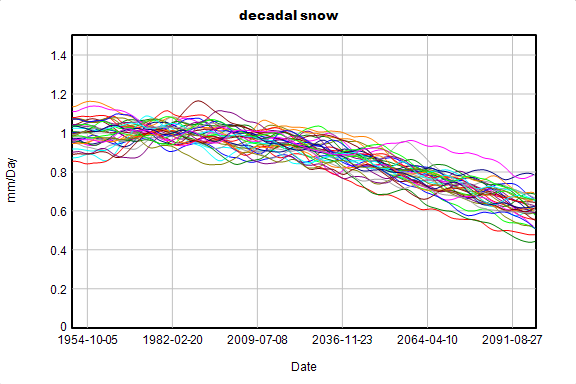
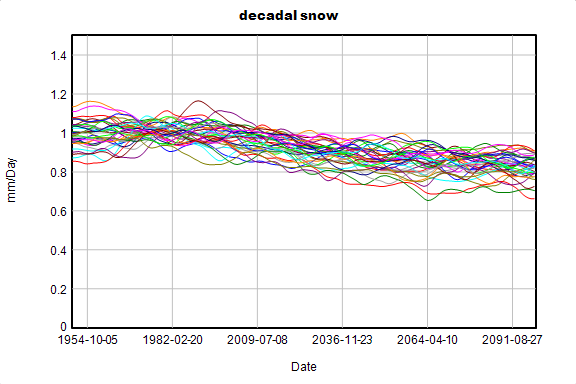
If you define snow as “precipitation when it’s below freezing,” it’s possible to make a rough indicator for snowfall. This will be highly dependent on topography, and therefore should be taken with a grain of salt, but it’s not a pretty picture – it declines almost 40% by the end of the century, in spite of the increase in total precipitation. The change is primarily due to a dramatic reduction in the number of days below freezing.
Aggressive Mitigation
Now the good news. Aggressive emissions reductions (RCP 26) really work. Temperature stabilizes within about 2 decades, reaching less than half the total change from y2000:
Similarly, the changes in precipitation and “snowfall” are much more manageable:
With each year of inaction, it gets harder to achieve a low-emissions scenario like RCP26, because capital turnover (the lifetime of buildings, equipment and vehicle fleets) constrains how fast emissions can fall. At the same time, it gets more urgent to reduce emissions, because the commitment to warming in the pipeline gets bigger.