
I ran across an interesting dynamic model of the opioid epidemic that makes a good target for replication and critique:
Prevention of Prescription Opioid Misuse and Projected Overdose Deaths in the United States
Qiushi Chen; Marc R. Larochelle; Davis T. Weaver; et al.
Importance Deaths due to opioid overdose have tripled in the last decade. Efforts to curb this trend have focused on restricting the prescription opioid supply; however, the near-term effects of such efforts are unknown.
Objective To project effects of interventions to lower prescription opioid misuse on opioid overdose deaths from 2016 to 2025.
Design, Setting, and Participants This system dynamics (mathematical) model of the US opioid epidemic projected outcomes of simulated individuals who engage in nonmedical prescription or illicit opioid use from 2016 to 2025. The analysis was performed in 2018 by retrospectively calibrating the model from 2002 to 2015 data from the National Survey on Drug Use and Health and the Centers for Disease Control and Prevention.
…
Conclusions and Relevance This study’s findings suggest that interventions targeting prescription opioid misuse such as prescription monitoring programs may have a modest effect, at best, on the number of opioid overdose deaths in the near future. Additional policy interventions are urgently needed to change the course of the epidemic.
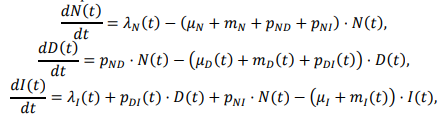
The model is fully described in supplementary content, but unfortunately it’s implemented in R and described in Greek letters, so it can’t be run directly:
That’s actually OK with me, because I think I learn more from implementing the equations myself than I do if someone hands me a working model.
While R gives you access to tremendous tools, I think it’s not a good environment for designing and testing dynamic models of significant size. You can’t easily inspect everything that’s going on, and there’s no easy facility for interactive testing. So, I was curious whether that would prove problematic in this case, because the model is small.
Here’s what it looks like, replicated in Vensim:
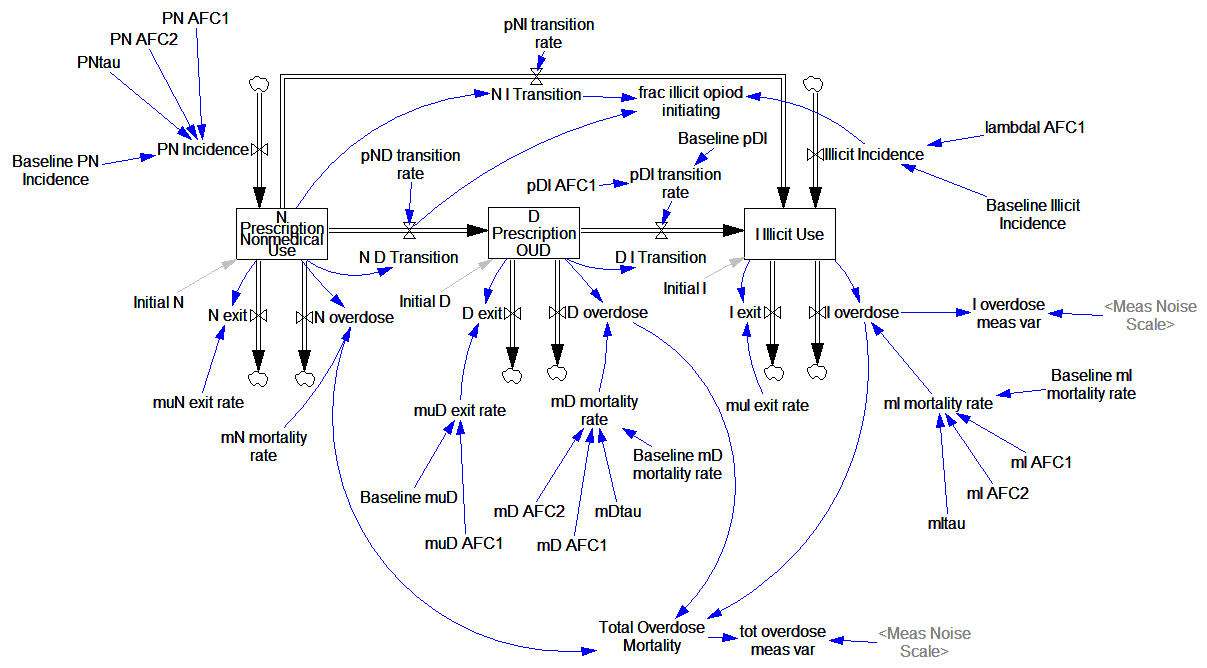
It looks complicated, but it’s not complex. It’s basically a cascade of first-order delay processes: the outflow from each stock is simply a fraction per time. There are no large-scale feedback loops.
Joinpoints
The “complicated’ part arises from parameters with “joinpoint” estimates. These are simply continuous functions with discontinuous derivatives, where the discontinuity occurs at a specified point. For example:
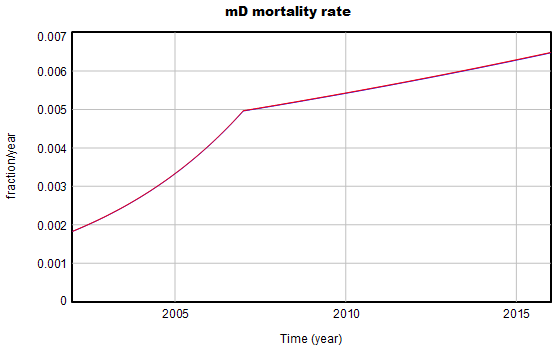
The parameters for some of these curves are estimated one at a time from data reported in the paper. Open-loop estimates sometimes work in integrated models (contrary to this), particularly if there’s little feedback and measurement error isn’t a big problem, as in this case.
The joinpoint equation looks like this, where β is the parameter of interest:
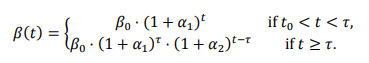
I find the (1+rate)^time expression annoying, because it’s dimensionally inconsistent, unless time is dimensionless. So, ignoring my own recent advice, I initially translated these expressions to EXP(rate*time). That turns out not to work well, because some of the rates are large – 20 or 30 % per year. So, I ended up reverting to the paper’s version, with a multiplier to reconcile the units:
mD mortality rate = Baseline mD mortality rate
   *( 1+mD AFC1*one year)^((MIN(Time,mDtau)-INITIAL TIME)/one year)
   *( 1+mD AFC2*one year)^((MAX(Time,mDtau)-mDtau)/one year)
With the joinpoints working, I imported parameters from tables in the paper and fired up the model.
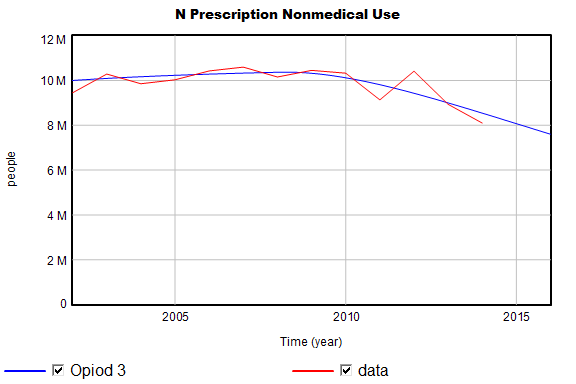
Behavior & Calibration
The model’s behavior is generally very close to the published results and data. For example:
I do find one significant variance, which I think has an interesting origin:

Total mortality is biased upwards somewhat. It’s fairly easy to causal trace and discover that some combination of D overdose and N overdose must be the cause (I overdose and some other candidates are ruled out because they’re constrained by data). Modifying the baseline Md mortality rate slightly removes the bias in the curves above.
I think this problem arises because the reported parameters are population means from a set of Monte Carlo simulations:

From the paper, we know the marginal distributions of the parameters, but not the joint distributions. Some of the distributions are also highly skewed. So, the behavior of the model with all the marginal mean parameters doesn’t necessarily match the mean behavior of the model.
I reestimated the parameters with and without Kalman filtering, and found that the bias disappeared, as one would hope. The parameter estimates are also broadly similar to those reported in the paper. Running a Markov Chain Monte Carlo simulation reveals that there are indeed strong correlations among some parameters. Here’s a scatter plot matrix of a subset of the large parameter space:

Scope
What I find really striking is the difference in approach between this model and earlier SD models of drug epidemics. In this model, there’s no explicit behavior, and no representation of the resources (like drug availability, dealers, prices, enforcement effort) that might cause the rates to be what they are. Contrast that with the following, from Levin, Hirsch & Roberts, Narcotics and the Community: a Systems Simulation:
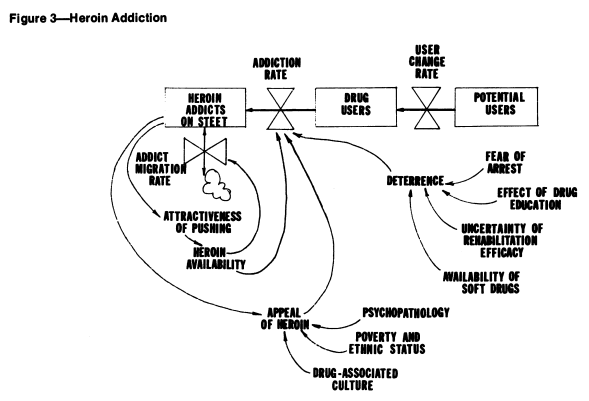
Here (and in other SD work), some key drivers are represented, like deterrence, and the positive loop of users becoming dealers and engaging new users.
Which approach is better? I think that depends on your purpose. The present model is simple and well grounded in the “physics” of population stocks and flows. That makes it easy to identify which particular parameters (in particular, the slopes of the various joinpoint segments) have high leverage on future mortality.
At the same time, heavy use of joinpoints (or more generally, time-varying parameters) essentially makes all the interesting behavior of the model exogenous. If you want to find leverage points, you need a model that spans enough of the system to include key feedback loops. This model suggests where to look, because large populations or strong trends suggest that a significant number of people will be harmed.
If you want to know how and why things are changing, or if you want to interact with stakeholders to fix the system, you’d have to know more about the causal drivers. Is the influx of illicit users due to reinforcing word-of-mouth? Or are drug dealers reinvesting there earnings in marketing?
The Model
This archive contains the model in Vensim .mdl and .vpm format, with supporting optimization control files and the datasets shown above. It should work in PLE, but you really want Pro or DSS to explore parameter estimation and other advanced features.
1 thought on “Opiod Epidemic Dynamics”