The survival value of wrong beliefs

… reasons for the survival of antiscientific views. It’s basically a matter of evolution. When crazy ideas negatively affect survival, they die out. But evolutionary forces are vastly diminished under some conditions, or even point the wrong way …

NPR has an alarming piece on school science.

She tells her students — like Nick Gurol, whose middle-schoolers believe the Earth is flat — that, as hard as they try, science teachers aren’t likely to change a student’s misconceptions just by correcting them. Gurol says his students got the idea of a flat planet from basketball star Kyrie Irving, who said as much on a podcast.

“And immediately I start to panic. How have I failed these kids so badly they think the Earth is flat just because a basketball player says it?” He says he tried reasoning with the students and showed them a video. Nothing worked.

“They think that I’m part of this larger conspiracy of being a round-Earther. That’s definitely hard for me because it feels like science isn’t real to them.”

For cases like this, Yoon suggests teachers give students the tools to think like a scientist. Teach them to gather evidence, check sources, deduce, hypothesize and synthesize results. Hopefully, then, they will come to the truth on their own.

This called to mind a post from way back, in which I considered reasons for the survival of antiscientific views.

It’s basically a matter of evolution. When crazy ideas negatively affect survival, they die out. But evolutionary forces are vastly diminished under some conditions, or even point the wrong way:

  1. Non-experimental science (reliance on observations of natural experiments; no controls or randomized assignment)
  2. Infrequent replication (few examples within the experience of an individual or community)
  3. High noise (more specifically, low signal-to-noise ratio)
  4. Complexity (nonlinearity, integrations or long delays between cause and effect, multiple agents, emergent phenomena)
  5. “Unsalience” (you can’t touch, taste, see, hear, or smell the variables in question)
  6. Cost (there’s some social or economic penalty  imposed by the policy implications of the theory)
  7. Commons (the risk of being wrong accrues to society more than the individual)

These are, incidentally, some of the same circumstances that make medical trials difficult, such that most papers are false.

Consider the flat earth idea. What cost accrues to students who hold this belief? None whatsoever, I think. A flat earth model will make terrible predictions of all kinds of things, but students are not making or relying on such predictions. The roundness of the earth is obviously not salient. So really, the only survival value that matters to students is the benefit of tribal allegiance.

If there are intertemporal dynamics, the situation is even worse. For any resource or capability investment problem, there’s worse before better behavior. Recovering depleted fish stocks requires diminished effort, and less to eat, in the near term. If a correct belief implies good long run stock management, adherents of the incorrect belief will have an advantage in the short run. You can’t count on selection weeding out the “dumb tribes” for planetary-scale problems, because we’re all in one.

This seems like a pretty intractable problem. If there’s a way out, it has to be cultural. If there were a bit more recognition of the value on making correct predictions, the halo of that would spill over to diminish the attractiveness of silly theories. That’s a case that ought to be compelling for basketball fans. Who wants to play on a team that can’t predict what the opponents will do, or how the ball will bounce?

System 3 thinking

There was lots of talk of dual process theory at the 2017 System Dynamics Conference. Nelson Repenning discussed it in his plenary presentation. The Donella Meadows Award paper investigated the effects on stock-flow task performance of priming subjects to think in System 2:

The dual-process theory and understanding of stocks and flows

Arash Baghaei Lakeh and Navid Ghaffarzadegan

Recent evidence suggests that using the analytic mode of thinking (System 2) can improve people’s performance in stock–flow (SF) tasks. In this paper, we further investigate the effects by implementing several different interventions in two studies. First, we replicate a previous finding that answering analytical questions before the SF task approximately doubles the likelihood of answering the stock questions correctly. We also investigate effects of three other interventions that can potentially prime participants to use their System 2. Specifically, the first group is asked to justify their response to the SF task; the second group is warned about the difficulty of the SF task; and the third group is offered information about cognitive biases and the role of the analytic mode of thinking. We find that the second group showed a statistically significant improvement in their performance. We claim that there are simple interventions that can modestly improve people’s response in SF tasks.

Dual process refers to the idea that there are two systems of thinking at work in our minds. System 1 is fast, automatic intuition. System 2 is slow, rational reasoning.

I’ve lost track of the conversation, but some wag at the conference (not me; possibly Arash)  coined the term “System 3” for model-assisted thinking.

In a sense, any reasoning is “model-assisted,” but I think there’s an important distinction between purely mental reasoning and reasoning with a formal (usually computerized) modeling method like a dynamic simulation or even a spreadsheet.

When we reason in our heads, we have to simultaneously (A) describe the structure of the problem, (B) predict the behavior implied by the structure, and (C) test the structure against available information. Mentally, we’re pretty good at A, but pretty bad at B and C. No one can reliably simulate even a low-order dynamic system in their head, and there are too many model checks against data and thought experiments (like extreme conditions) to “run” without help.

System 3’s great weakness is that it takes still more time than using System 2. But it makes up for that in three ways. First, reliable predictions and tests of behavior reveal misconceptions about the problem/system structure that are otherwise inaccessible, so the result is higher quality. Second, the model is shareable, so it’s easier to convey insights to other stakeholders who need to be involved in a solution. Third, formal models can be reused, which lowers the effective cost of an application.

But how do you manage that “still more time” problem? Consider this advice:

I discovered a simple solution to making challenging choices more efficiently at an offsite last week with the CEO and senior leadership team of a high tech company. They were facing a number of unique, one-off decisions, the outcomes of which couldn’t be accurately predicted.

These are precisely the kinds of decisions which can linger for weeks, months, or even years, stalling the progress of entire organizations. …

But what if we could use the fact that there is no clear answer to make a faster decision?

“It’s 3:15pm,” He [the CEO] said. “We need to make a decision in the next 15 minutes.”

“Hold on,” the CFO responded, “this is a complex decision. Maybe we should continue the conversation at dinner, or at the next offsite.”

“No,” The CEO was resolute, “We will make a decision within the next 15 minutes.”

And you know what? We did.

Which is how I came to my third decision-making method: use a timer.

I’m in favor of using a timer to put a stop to dithering. Certainly a body with scarce time should move on when it perceives that it can’t add value. But this strikes me as a potentially costly reversion to System 1.

If a problem is strategic enough to make it to the board, but the board sees a landscape that prevents a clear decision, it ought to be straightforward to articulate why. Are there tradeoffs that make the payoff surface flat? The timer is a sensible response to that, because the decision doesn’t require precision. Are there competing feedback loops that suggest different leverage points, for which no one can agree about the gain? In that case, the consequence of an error could be severe, so the default answer should include a strategy for detection and correction. One ought to have a way to discriminate between these two situations, and a simple application of System 3 might be just the tool.


The intuitive mind is a gag gift

I saw Einstein quoted yesterday, “The intuitive mind is a sacred gift and the rational mind is a faithful servant. We have created a society that honors the servant and has forgotten the gift.”

I wondered what he meant, because I think of the intuitive mind as a treacherous friend. We can’t do without it, because we have too many decisions to make. You’d never get out of bed if everything had to be evaluated rationally. But at the same time, whatever heuristics are going on in there are the same ones that,

… and indulge in dozens of other biases. I think they’re also why Lightroom’s face recognition mixes me up with my dog.

How could Einstein revere intuition above reason? Perhaps he relished the intuitive guess at an equation, or some kind of Occam’s Razor argument about simplicity and beauty?

Well, it appears that the answer is simple, but not too simple. He didn’t say it.

Data Science should be about more than data

There are lots of “top 10 skills” lists for data science and analytics. The ones I’ve seen are all missing something huge.

Here’s an example:

Business Broadway – Top 10 Skills in Data Science

Modeling barely appears here. Almost all the items concern the collection and analysis of data (no surprise there). Just imagine for a moment what it would be like if science consisted purely of observation, with no theorizing.

What are you doing with all those data points and the algorithms that sift through them? At some point, you have to understand whether the relationships that emerge from your data make any sense and answer relevant questions. For that, you need ways of thinking and talking about the structure of the phenomena you’re looking at and the problems you’re trying to solve.

I’d argue that one’s literacy in data science is greatly enhanced by knowledge of mathematical modeling and simulation. That could be system dynamics, control theory, physics, economics, discrete event simulation, agent based modeling, or something similar. The exact discipline probably doesn’t matter, so long as you learn to formalize operational thinking about a problem, and pick up some good habits (like balancing units) along the way.

The Ambiguity of Causal Loop Diagrams and Archetypes

I find causal loop diagramming to be a very useful brainstorming and presentation tool, but it falls short of what a model can do for you.

Here’s why. Consider the following pair of archetypes (Eroding Goals and Escalation, from wikipedia):

Eroding Goals and Escalation archetypes

Archetypes are generic causal loop diagram (CLD) templates, with a particular behavior story. The Escalation and Eroding Goals archetypes have identical feedback loop structures, but very different stories. So, there’s no unique mapping from feedback loops to behavior. In order to predict what a set of loops is going to do, you need more information.

Here’s an implementation of Eroding Goals:

Notice several things:

  • I had to specify where the stocks and flows are.
  • “Actions to Improve Goals” and “Pressure to Adjust Conditions” aren’t well defined (I made them proportional to “Gap”).
  • Gap is not a very good variable name.
  • The real world may have structure that’s not mentioned in the archetype (indicated in red).

Here’s Escalation:

The loop structure is mathematically identical; only the parameterization is different. Again, the missing information turns out to be crucial. For example, if A and B start with the same results, there is no escalation – A and B results remain constant. To get escalation, you either need (1) A and B to start in different states, or (2) some kind of drift or self-excitation in decision making (green arrow above).

Even then, you may get different results. (2) gives exponential growth, which is the standard story for escalation. (1) gives escalation that saturates:

The Escalation archetype would be better if it distinguished explicit goals for A and B results. Then you could mathematically express the key feature of (2) that gives rise to arms races:

  • A’s goal is x% more bombs than B
  • B’s goal is y% more bombs than A

Both of these models are instances of a generic second-order linear model that encompasses all possible things a linear model can do:

Notice that the first-order and second-order loops are disentangled here, which makes it easy to see the “inner” first order loops (which often contribute damping) and the “outer” second order loop, which can give rise to oscillation (as above) or the growth in the escalation archetype. That loop is difficult to discern when it’s presented as a figure-8.

Of course, one could map these archetypes to other figure-8 structures, like:

How could you tell the difference? You probably can’t, unless you consider what the stocks and flows are in an operational implementation of the archetype.

The bottom line is that the causal loop diagram of an archetype or anything else doesn’t tell you enough to simulate the behavior of the system. You have to specify additional assumptions. If the system is nonlinear or stochastic, there might be more assumptions than I’ve shown above, and they might be important in new ways. The process of surfacing and testing those assumptions by building a stock-flow model is very revealing.

If you don’t build a model, you’re in the awkward position of intuiting behavior from structure that doesn’t uniquely specify any particular mode. In doing so, you might be way ahead of non-systems thinkers approaching the same problem with a laundry list. But your ability to discover errors, incorporate data and discover leverage is far greater if you can simulate.

The model: wikiArchetypes1b.mdl (runs in any version of Vensim)

Loopy

I just gave Loopy a try, after seeing Gene Bellinger’s post about it.

It’s cool for diagramming, and fun. There are some clever features, like drawing a circle to create a node (though I was too dumb to figure that out right away). Its shareability and remixing are certainly useful.

However, I think one must be very cautious about simulating causal loop diagrams directly. A causal loop diagram is fundamentally underspecified, which is why no method of automated conversion of CLDs to models has been successful.

In this tool, behavior is animated by initially perturbing the system (e.g, increase the number of rabbits in a predator-prey system). Then you can follow the story around a loop via animated arrow polarity changes – more rabbits causes more foxes, more foxes causes less rabbits. This is essentially the storytelling method of determining loop polarity, which I’ve used many times to good effect.

However, as soon as the system has multiple loops, you’re in trouble. Link polarity tells you the direction of change, but not the gain or nonlinearity. So, when multiple loops interact, there’s no way to determine which is dominant. Also, in a real system it matters which nodes are stocks; it’s not sufficient to assume that there must be at least one integration somewhere around a loop.

You can test this for yourself by starting with the predator-prey example on the home page. The initial model is a discrete oscillator (more rabbits -> more foxes -> fewer rabbits). But the real system is nonlinear, with oscillation and other possible behaviors, depending on parameters. In Loopy, if you start adding explicit births and deaths, which should get you closer to the real system, simulations quickly result in a sea of arrows in conflicting directions, with no way to know which tendency wins. So, the loop polarity simulation could be somewhere between incomprehensible and dead wrong.

Similarly, if you consider an SIR infection model, there are three loops of interest: spread of infection by contact, saturation from running out of susceptibles, and recovery of infected people. Depending on the loop gains, it can exhibit different behaviors. If recovery is stronger than spread, the infection dies out. If spread is initially stronger than recovery, the infection shifts from exponential growth to goal seeking behavior as dominance shifts nonlinearly from the spread loop to the saturation loop.

I think it would be better if the tool restricted itself to telling the story of one loop at a time, without making the leap to system simulations that are bound to be incorrect in many multiloop cases. With that simplification, I’d consider this a useful item in the toolkit. As is, I think it could be used judiciously for explanations, but for conceptualization it seems likely to prove dangerous.

My mind goes back to Barry Richmond’s approach to systems here. Causal loop diagrams promote thinking about feedback, but they aren’t very good at providing an operational description of how things work. When you’re trying to figure out something that you don’t understand a priori, you need the bottom-up approach to synthesize the parts you understand into the whole you’re grasping for, so you can test whether your understanding of processes explains observed behavior. That requires stocks and flows, explicit goals and actual states, and all the other things system dynamics is about. If we could get to that as elegantly as Loopy gets to CLDs, that would be something.

Aging is unnatural

Larry Yeager and I submitted a paper to the SD conference, proposing dynamic cohorts as a new way to model aging populations, vehicle fleets, and other quantities. Cohorts aren’t new*, of course, but Ventity makes it practical to allocate them on demand, so you don’t waste computation and attention on a lot of inactive zeroes.

The traditional alternative has been aging chains. Setting aside technical issues like dispersion, I think there’s a basic conceptual problem with aging chains: they aren’t a natural, intuitive operational representation of what’s happening in a system. Here’s why.

Consider a model of an individual. You’d probably model age like this:

Here, age is a state of the individual that increases with aging. Simple. Equivalently, you could calculate it from the individual’s birth date:

Ideally, a model of a population would preserve the simplicity of the model of the individual. But that’s not what the aging chain does:

This says that, as individuals age, they flow from one stock to another. But there’s no equivalent physical process for that. People don’t flow anywhere on their birthday. Age is continuous, but the separate stocks here represent an arbitrary discretization of age.

Even worse, if there’s mortality, the transition time from age x to age x+1 (the taus on the diagram above) is not precisely one year.

You can contrast this with most categorical attributes of an individual or population:

When cars change (geographic) state, the flow represents an actual, physical movement across a boundary, which seems a lot more intuitive.

As we’ll show in the forthcoming paper, dynamic cohorts provide a more natural link between models of individuals and groups, and make it easy to see the lifecycle of a set of related entities. Here are the population sizes of annual cohorts for Japan:

I’ll link the paper here when it’s available.


* This was one of the applications we proposed in the original Ventity white paper, and others have arrived at the same idea, minus the dynamic allocation of the cohorts. Demographers have been doing it this way for ages, though usually in statistical approaches with no visual representation of the system.

Dynamics of the last Twinkie

When Hostess went bankrupt in 2012, there was lots of speculation about the fate of the last Twinkie, perhaps languishing on the dusty shelves of a gas station convenience store somewhere in New Mexico. Would that take ten days, ten weeks, ten years?

So, what does this have to do with system dynamics? It calls to mind the problem of modeling the inventory stockout constraint on sales. This problem dates back to Industrial Dynamics (see the variable NIR driving SSR and the discussion around figs. 15-5 and 15-7).

If there’s just one product in one inventory (i.e. one store), and visibility doesn’t matter, the constraint is pretty simple. As long as there’s one item left, sales or shipments can proceed. The constraint then is:

(1) selling = MIN(desired selling, inventory/time step)

In other words, the most that can be sold in one time step is the amount of inventory that’s actually on hand. Generically, the constraint looks like this:

Here, tau is a time constant, that could be equal to time step (DT), as above, or could be generalized to some longer interval reflecting handling and other lags.

This can be further generalized to some kind of continuous function, like:

(2) selling = desired selling * f( inventory )

where f() is often a lookup table. This can be a bit tricky, because you have to ensure that f() goes to zero fast enough to obey the inventory/DT constraint above.

But what if you have lots of products and/or lots of inventory points, perhaps with different normal turnover rates? How does this aggregate? I built the following toy model to find out. You could easily do this in Vensim with arrays, but I found that it was ideally suited to Ventity.

Here’s the setup:

First, there’s a collection of Store entities, each with an inventory. Initial inventory is random, with a Poisson distribution, which ensures integer twinkies. Customer arrivals also have a Poisson distribution, and (optionally), the mean arrival rate varies by store. Selling is constrained to stock on hand via inventory/DT, and is also subject to a visibility effect – shelf stock influences the probability that a customer will buy a twinkie (realized with a Binomial distribution). The visibility effect saturates, so that there are diminishing returns to adding stock, as occurs when new stock goes to the back rows of the shelf, for example.

In addition, there’s an Aggregate entitytype, which is very similar to the Store, but deterministic and continuous.

The Aggregate’s initial inventory and sales rates are set to the expected values for individual stores. Two different kinds of constraints on the inventory outflow are available: inventory/tau, and f(inventory). The sales rate simplifies to:

(3) selling = min(desired sales rate*f(inventory),Inventory/Min time to sell)

(4) min time to sell >= time step

In the Store and the Aggregate, the nonlinear effect of inventory on sales (called visibility in the store) is given by

(5) f(inventory) = 1-Exp(-Inventory/Threshold)

However, the aggregate threshold might be different from the individual store threshold (and there’s no compelling reason for the aggregate f() to match the individual f(); it was just a simple way to start).

In the Store[] collection, I calculate aggregates of the individual stores, which look quite continuous, even though the population is only 100. (There are over 100,000 gas stations in the US.)

Notice that the time series behavior of the effect of inventory on sales is sigmoid.

Now we can compare individual and aggregate behavior:

Inventory

Selling

The noisy yellow line is the sum of the individual Stores. The blue line arises from imposing a hard cutoff, equation (1) above. This is like assuming that all stores are equal, and inventory doesn’t affect sales, until it’s gone. Clearly it’s not a great fit, though it might be an adequate shortcut where inventory dynamics are not really the focus of a model.

The red line also imposes an inventory/tau constraint, but the time constant (tau) is much longer than the time step, at 8 days (time step = 1 day). Finally, the purple sigmoid line arises from imposing the nonlinear f(inventory) constraint. It’s quite a good fit, but the threshold for the aggregate must be about twice as big as for the individual Stores.

However, if you parameterize f() poorly, and omit the inventory/tau constraint, you get what appear to be chaotic oscillations – cool, but obviously unphysical:

If, in addition, you add diversity in Store’s customer arrival rates, you get a longer tail on inventory. That last Twinkie is likely to be in a low-traffic outlet. This makes it a little tougher to fit all parts of the curve:

I think there are some interesting questions here, that would make a great paper for the SD conference:

  • (Under what conditions) can you derive the functional form of the aggregate constraint from the properties of the individual Stores?
  • When do the deficiencies of shortcut approaches, that may lack smooth derivatives, matter in aggregate models like Industrial dynamics?
  • What are the practical implications for marketing models?
  • What can you infer about inventory levels from aggregate data alone?
  • Is that really chaos?

Have at it!

The Ventity model: LastTwinkie1.zip

Data science meets the bottom line

A view from simulation & System Dynamics


I come to data science from simulation and System Dynamics, which originated in control engineering, rather than from the statistics and database world. For much of my career, I’ve been working on problems in strategy and public policy, where we have some access to mental models and other a priori information, but little formal data. The attribution of success is tough, due to the ambiguity, long time horizons and diverse stakeholders.

I’ve always looked over the fence into the big data pasture with a bit of envy, because it seemed that most projects were more tactical, and establishing value based on immediate operational improvements would be fairly simple. So, I was surprised to see data scientists’ angst over establishing business value for their work:

One part of solving the business value problem comes naturally when you approach things from the engineering point of view. It’s second nature to include an objective function in our models, whether it’s the cash flow NPV for a firm, a project’s duration, or delta-V for a rocket. When you start with an abstract statistical model, you have to be a little more deliberate about representing the goal after the model is estimated (a simulation model may be the delivery vehicle that’s needed).

You can solve a problem whether you start with the model or start with the data, but I think your preferred approach does shape your world view. Here’s my vision of the simulation-centric universe:

The more your aspirations cross organizational silos, the more you need the engineering mindset, because you’ll have data gaps at the boundaries – variations in source, frequency, aggregation and interpretation. You can backfill those gaps with structural knowledge, so that the model-data combination yields good indirect measurements of system state. A machine learning algorithm doesn’t know about dimensional consistency, conservation of people, or accounting identities unless the data reveals such structure, but you probably do. On the other hand, when your problem is local, data is plentiful and your prior knowledge is weak, an algorithm can explore more possibilities than you can dream up in a given amount of time. (Combining the two approaches, by using prior knowledge of structure as “free data” constraints for automated model construction, is an area of active research here at Ventana.)

I think all approaches have a lot in common. We’re all trying to improve performance with systems science, we all have to deal with messy data that’s expensive to process, and we all face challenges formulating problems and staying connected to decision makers. Simulations need better connectivity to data and users, and purely data driven approaches aren’t going to solve our biggest problems without some strategic context, so maybe the big data and simulation worlds should be working with each other more.

Cross-posted from LinkedIn

Why so many incompetent leaders, period?

The HBR has a nice article asking, Why Do So Many Incompetent Men Become Leaders? Gender may amplify the problem, but I think its roots lie much deeper. We have a general surplus of incompetence across all walks of life.

So, how does this unhappy situation persist? One would hope that evolution would take care of this – that companies or nations that were systematically fooled by confidence over substance would be naturally selected out of the population. But that doesn’t seem to happen.

I think the explanation lies in the weaknesses of our mental models (and failure to refine them with formal models), and therefore our inability to attribute success and failure to decisions, in hindsight or prospects.

The HBR has a nice article asking, Why Do So Many Incompetent Men Become Leaders? Some excerpts:

In my view, the main reason for the uneven management sex ratio is our inability to discern between confidence and competence. That is, because we (people in general) commonly misinterpret displays of confidence as a sign of competence, we are fooled into believing that men are better leaders than women. In other words, when it comes to leadership, the only advantage that men have over women … is the fact that manifestations of hubris — often masked as charisma or charm — are commonly mistaken for leadership potential, and that these occur much more frequently in men than in women.

The truth of the matter is that pretty much anywhere in the world men tend to think that they that are much smarter than women. Yet arrogance and overconfidence are inversely related to leadership talent — the ability to build and maintain high-performing teams, and to inspire followers to set aside their selfish agendas in order to work for the common interest of the group.

The paradoxical implication is that the same psychological characteristics that enable male managers to rise to the top of the corporate or political ladder are actually responsible for their downfall. In other words, what it takes to get the job is not just different from, but also the reverse of, what it takes to do the job well. …

In fact, most leaders — whether in politics or business — fail. That has always been the case: the majority of nations, companies, societies and organizations are poorly managed, as indicated by their longevity, revenues, and approval ratings, or by the effects they have on their citizens, employees, subordinates or members. Good leadership has always been the exception, not the norm.

Gender may amplify the problem, but I think its roots lie much deeper. We have a general surplus of incompetence across all walks of life.

So, how does this unhappy situation persist? One would hope that evolution would take care of this – that companies or nations that were systematically fooled by confidence over substance would be naturally selected out of the population. But that doesn’t seem to happen.

I think the explanation lies in the weaknesses of our mental models (and failure to refine them with formal models), and therefore our inability to attribute success and failure to decisions, in hindsight or prospects.  Here’s the purest expression of this line of thinking I’ve seen:

Why I Switched My Endorsement from Clinton to Trump

1. Things I Don’t Know: There are many things I don’t know. For example, I don’t know the best way to defeat ISIS. Neither do you. I don’t know the best way to negotiate trade policies. Neither do you. I don’t know the best tax policy to lift all boats. Neither do you. …. So on most political topics, I don’t know enough to make a decision. Neither do you, but you probably think you do.

3. Party or Wake: It seems to me that Trump supporters are planning for the world’s biggest party on election night whereas Clinton supporters seem to be preparing for a funeral. I want to be invited to the event that doesn’t involve crying and moving to Canada. (This issue isn’t my biggest reason.)

Scott Adams, Dilbert creator

If you can’t predict which leader’s proposals or methods will work, why not go with the ones that sound the best? Or, if you can’t figure out how to grow the pie for everyone, why not at least choose the tribal affiliation that gives you the best chance at a slice of patrimony?

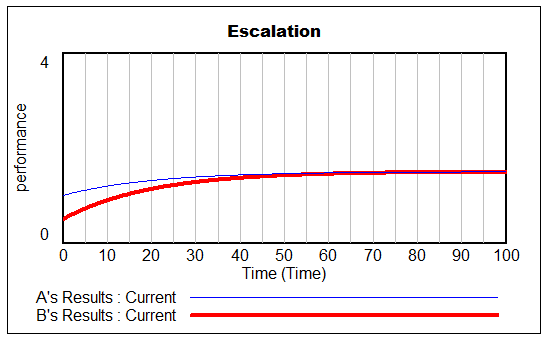
Still, at the end of the day, the honeymoon is over, and the effects of decisions should come home to roost, right? Not necessarily. Even after the fact, attribution of causality in dynamic systems is difficult, because causes and effects are separated in space in time. So, you can’t learn to do better by simple pattern matching; you have to understand the structure that’s producing behavior. Firm policies and election rules worsen the problem by rotating people around, so that they can launch initiatives and be gone before the consequences are observed, defeating evolution.

John Sterman and Nelson Repenning explain in another context:

The Capability Trap
The capability trap arises from the interactions between judg-
mental biases and the physical structure of work processes.
For example, machine operators or design engineers facing a
shortfall may initially work harder …, do more rework
…, or focus on throughput …, all of which
reduce the time available for improvement. These responses
are tempting because they yield immediate gains, while their
costs are distant in time and space, uncertain, and hard to
detect. But, while throughput improves in the short run, the
reduction in time dedicated to learning causes process capa-
bility to decline. Eventually, workers find themselves again
falling short of their throughput target, forcing a further shift
toward working and away from improving. Instead of making
up for the improvement activity they skipped earlier, their
own past actions, by causing the reinvestment loops … to work as vicious cycles, trap them in a downward
spiral of eroding process capability, increasing work hours,
and less and less time for improvement.

Misperceptions of Feedback
While the literature and field data support the links in the
model, our account of the capability trap raises several
questions. First, wouldn’t people recognize the existence of
the reinforcing feedbacks that create the trap and take
actions to avoid it? Second, if they find themselves stuck in
the trap, wouldn’t people learn to escape it by making appro-
priate short-term sacrifices? Studies of decision making in
dynamic environments suggest that such learning is far from
automatic.
Consider the outcome feedback received from a decision to
spend more time working and less on improvement. Perfor-
mance quickly increases, producing a clear, salient, unam-
biguous outcome. In contrast, the negative consequences of
this action—the decline in process capability—take time, are
hard to observe, and may have ambiguous interpretations. In
experiments ranging from running a simulated production and
distribution system (Sterman, 1989) to fighting a simulated
forest fire (Brehmer, 1992) or managing a simulated fishery
(Moxnes, 1999), subjects have been shown to grossly over-
weight the short-run positive benefits of their decisions while
ignoring the long-run, negative consequences. Participants in
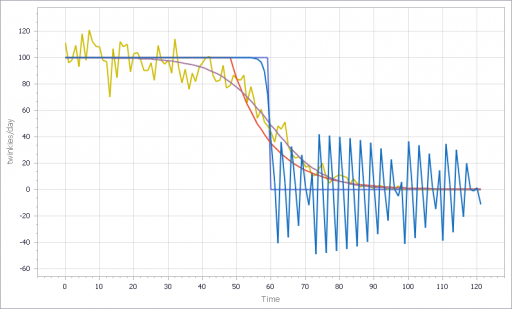
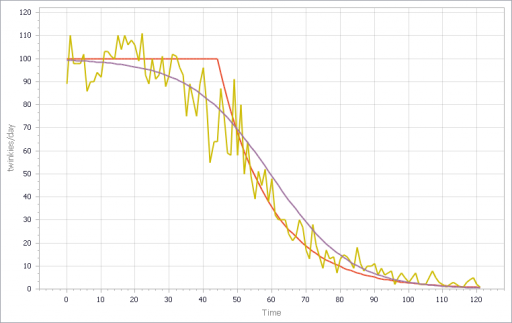
these experiments produce wildly oscillating production
rates, allow their fire-fighting headquarters to burn down, and
find their fleets idled after overexploiting their fisheries.
….

Once caught in the capability trap, people are also unlikely to
learn to escape it. A new improvement program, by reducing
the time available for throughput, causes an immediate and
salient drop in performance, while its benefits are uncertain,
delayed, difficult to assess, and may be insufficient to switch
the reinforcing feedbacks to virtuous cycles. People are likely
to conclude that the improvement program they attempted
does not work and should be abandoned.

Attribution Errors in Judging the Cause of Low Throughput
When choosing to emphasize first- or second-order improve-
ment, managers must make a judgment about the causes of
low process throughput. If they believe the cause of low per-
formance lies in the physical structure of the process, they
are likely to focus their efforts on process improvement. If,
however, low throughput is thought to result from lack of
worker effort or discipline, then managers are better off

focusing on increasing the quantity of work. The cues people

use to make causal attributions include temporal order,
covariation, and contiguity in time and space (Einhorn and
Hogarth, 1986). Attributing low throughput to inadequate
worker effort is consistent with all these cues: …. Managers are thus likely to attribute a throughput shortfall to inadequate worker effort, even when the true causes are systemic process
problems.
Managers’ tendency to attribute performance shortfalls to
problems with the workforce rather than the production sys-
tem is reinforced by the so-called fundamental attribution
error, or dispositional bias. …. Existing research thus suggests that managers facing throughput gaps are likely to conclude that workers, not the process, are the cause of low throughput, reinforcing the bias against fundamental improvement.
As Sterman & Repenning go on to explain, these attribution errors are likely to become self-confirming, and to be institutionalized in organizational routines, leading to self-reinforcing organizational pathologies.
Blaming workers for productivity shortfalls that ultimately arise from the firm leadership’s failure to focus on process improvement is a lot like blaming poverty on the shortcomings of poor people, rather than their social environment, which subjects them to poor education, predatory monopolies and disproportionate criminal and environmental burdens. Programs that focus exclusively on motivating (or punishing) the impoverished are at least as naive as those that seek to alleviate poverty through transfers of money without creating skills or opportunities.
Back to Scott Adams, one argument in favor of unfounded overconfidence remains:

6. Persuasion: Economies are driven by psychology. If you expect things to go well tomorrow, you invest today, which causes things to go well tomorrow, as long as others are doing the same. The best kind of president for managing the psychology of citizens – and therefore the economy – is a trained persuader. You can call that persuader a con man, a snake oil salesman, a carnival barker, or full of shit. It’s all persuasion. And Trump simply does it better than I have ever seen anyone do it.

Most of the job of president is persuasion. Presidents don’t need to understand policy minutia. They need to listen to experts and then help sell the best expert solutions to the public. Trump sells better than anyone you have ever seen, even if you haven’t personally bought into him yet. You can’t deny his persuasion talents that have gotten him this far.

Psychology is in steady state over any reasonably long time horizon, so it’s not really psychology that drives economic growth. Psychology is necessary, in that people have to feel that conditions are right for risk-taking, but it’s not sufficient. The real long run driver is innovation, embodied in people, technology and organizations. That means it’s also necessary that innovations work, so investments produce, GDP makes people happy, schools teach, infrastructure serves, and wars defeat more enemies than they create. Mere bluster does not get you those things.
So here’s the problem: the overconfidence that lends itself to persuasion has side effects:
  • It’s hostile to “listening to experts” (or to anyone).
  • It favors naive, simple causal attributions over inquiry into system structure.
  • It opposes learning from feedback, whether from constituents or objective measurements.
  • Confronted by adversity, it retreats into confirmation bias and threat rigidity.

So, overconfidence doesn’t make the economy grow faster. It just makes things go faster, whether paradise or a cliff lies ahead.

I don’t think firms or planets want to speed off a cliff, so we need to do better. It’s a tall order, but I think awareness of the problem is a good start. After that, it’s a hard road, but we all need to become better system scientists, and spend more time participating in governance and attempting to understand how systems work.

There’s reason for hope – not all firms fall into capability traps. Emulating those that succeed, we might start by investing some time in process improvement. The flawed processes by which we now pick leaders look like low-hanging fruit to me.