Regional Climate Initiatives – Model Roll Call – Part II

Minnesota

The Minnesota Next Generation Energy Act establishes a goal of reducing GHG emissions by 15% by 2015, 30% by 2025, and 80% by 2050, relative to 2005 levels.

From ScienceDaily comes news of a new research report from University of Minnesota’s Center fro Transportation Studies. The study looks at options for reducing transport emissions. Interestingly, transport represents 24% of MN emissions, vs. more than 40% in CA. The study decomposes emissions according to a variant of the IPAT identity,

Emissions = (Fuel/VehicleMile) x (Carbon/Fuel) x (VehicleMilesTraveled)

Vehicle and fuel effects are then modeled with LEAP, an energy modeling platform with a fast-growing following. The VMT portion is tackled with a spreadsheet calculator from CCAP’s Guidebook. I haven’t had much time to examine the latter, but it considers a rich set of options and looks like at least a useful repository of data. However, it’s a static framework, and land use-transportation interactions are highly dynamic. I’d expect it to be a useful way to construct alternative transport system visions, but not much help determining how to get there from here.

Minnesota’s Climate Change Advisory Group TWG on land use and transportation has a draft inventory and forecast of emissions. The Energy Supply and Residential/Commercial/Industrial TWGs developed spreadsheet analyses of a number of options. Analysis and Assumptions memos describe the results, but the spreadsheets are not online.

British Columbia

OK, it’s not a US region, but maybe we could trade it for North Dakota. BC has a revenue-neutral carbon tax, supplemented by a number of other initiatives. The tax starts at $10/TonCO2 and rises $5/year to $30 by 2012. The tax is offset by low-income tax credits and 2 to 5% reductions in lower income tax brackets; business tax reductions match personal tax reductions in roughly a 1:2 ratio.

BC’s Climate Action Plan includes a quantitative analysis of proposed policies, based on the CIMS model. CIMS is a detailed energy model coupled to a macroeconomic module that generates energy service demands. CIMS sounds a lot like DOE’s NEMS, which means that it could be useful for determining near-term effects of policies with some detail. However, it’s probably way too big to modify quickly to try out-of-the-box ideas, estimate parameters by calibration against history, or perform Monte Carlo simulations to appreciate the uncertainty around an answer.

The BC tax demonstrates a huge advantage of a carbon tax over cap & trade: it can be implemented quickly. The tax was introduced in the Feb. 19 budget, and switched on July 1st. By contrast, the WCI and California cap & trade systems have been underway much longer, and still are no where near going live. The EU ETS was authorized in 2003, turned on in 2005, and still isn’t dialed in (plus it has narrower sector coverage). Why so fast? It’s simple – there’s no trading infrastructure to design, no price uncertainty to worry about, and no wrangling over allowance allocations (though the flip side of the last point is that there’s also no transient compensation for carbon-intensive industries).

Bizarrely, BC wants to mess everything up by layering cap & trade on top of the carbon tax, coordinated with the WCI (in which BC is a partner).

Climate War Game – China's Position

Given its large global presence in 2015, by any measure, China’s posture in the negotiations was critical. The Climate Game Times reported:

Climate Game Times - China Headline

China put forth a set of principles yesterday that will guide today’s continued negotiations on migration, disaster relief, resource scarcity, and emissions reductions…. These principles included statements that China’s efforts in these areas will be consistent with its development objectives, and that historical contributions to greenhouse gas emissions be considered in setting targets and dividing the responsibility for global mitigation.

In perhaps the most important detail to emerge from yesterday’s negotiations, the China team will continue to lead in pushing for technology transfers for mitigation and adaptation measures, particularly in emissions reductions, in land use and forestry, and in agriculture so as to encourage a new ‘green revolution.’

I spent much of my time sitting in on the China team’s deliberations. The discussion was very realistic when viewed in the light of 2008 developing country positions, but I began to wonder whether that position could lead to a good outcome for the people of China. Some underlying assumptions that trouble me:

Continue reading “Climate War Game – China's Position”

Google News, Trends, Insight

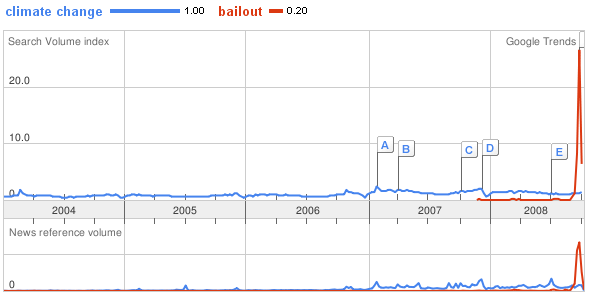
I’ve found trends on Google news interesting for some time. For example, did net news predict a housing bubble?

Google news housing bubble trendline

As online sources of such social data get richer, and control and normalization issues are solved or at least made transparent, they could become a useful input to behavioral models. Already, I find them to be a useful reality check, for seeing how long it takes for events to show up on popular radar, and whether things that seem big are really big in the public mind.

Continue reading “Google News, Trends, Insight”

Visual Geology

A cool portal for worldwide geological map information has just been launched. OneGeology is a portal, into which regional geologic survey agencies can link their data through a map interface. Users can access map info through a web interface akin to Google Maps. Regional and global layers can be added easily, as in a GIS tool. Here’s a map of rock age for Afghanistan, overlayed on NASA Modis imagery, generated in just a minute or two:

Afghanistan rock ages

Climate War Game – In Pictures

Two quick visualizations of the scenario data behind the war game:

First, a map of what happens to the concentration of atmospheric CO2 as a function of an emissions target to which participating regions adhere (y axis) and the regions participating (enumerated on the x axis). This is basically an elaboration of everyone plays. The color scheme on the surface shows atmospheric CO2 concentration in 2100 in slightly cryptic units (TonC). The important thing to know is that the bluest end of the scale (all in, aggressive targets) succeeds in staying under 466ppm, the reddest end (no action) is a disaster at up to 750ppm, and the green and turquoise bands are near 2x CO2. Click the graphic for a larger version.

Atmospheric CO2 as a function of global targets and regional participation

Second, a visual version of some of the data in the reduction illusion. Bubble size is proportional to regional CO2 emissions in 2015.

Regional population, emissions, GDP (2015 scenario)

Climate War Game – Reduction Illusion?

Is the cup half empty or half full? It seems to me that there are opportunities to get tripped up by even the simplest emissions math, as is the case with the MPG illusion. That complicates negotiations by introducing variations in regions’ perception of fairness, on top of contested value judgments.

Continue reading “Climate War Game – Reduction Illusion?”

Climate War Game – Everyone Plays

A fundamental tension in the war game arose from the fact that, regardless of development and equity considerations, all large nations would have to make cuts eventually, because there simply isn’t enough atmosphere to go around. Consider the following graph, showing the tradeoff in emissions cuts for a two-region world.
Regional emissions reduction tradeoffs
The x-axis shows the size of emissions reductions in a major region, representing a quarter of business as usual emissions (think US or China). The y-axis shows how much the rest of the world would have to cut to meet a global target, given the action of the first region. You can see from the solid orange line that meeting an 80% global cut requires at least a 20% cut from the major region. Otherwise, it’s not physically possible to balance the carbon account (unless free-air capture, a thermodynamic loser, becomes viable). A global target of a 90% cut from current levels – not an implausible requirement in the long run – requires at least 60% participation from the major nation above. Clearly the developing country position of do-nothing-but-grow can be no more than a transient if we are to make real progress on mitigation.

Climate War Game – Is 2050 Temperature Locked In?

This slide became known as “the Angry Red Future” at the war game:
The Angry Red Future

Source: ORNL & Pew via Nature In the Field

After seeing the presentation around it, Eli Kintisch of Science asked me whether it was realistic to assume that 2050 climate is already locked in. (Keep in mind that we were living in 2015.) I guessed yes, then quickly ran a few simulations to verify. Then I lost my train of thought and lost track of Eli. So, for what it’s still worth, here’s the answer.

Continue reading “Climate War Game – Is 2050 Temperature Locked In?”

Climate War Game – Takeaways

Over breakfast this morning (day three), I heard from several participants that the war game was “too easy” – that is, negotiators were too free to agree to aggressive commitments which their real-world constituents or bosses wouldn’t support. That wasn’t my observation in the China team room, and in closing statements it seemed that teams were taking their roles very seriously indeed. It’s not quite the Zimbardo Prison Experiment but it’s very real in some ways.

The following are some of the more poignant comments from players, with a little editorial license on my part. Hopefully I have attributions and the general drift correct; please comment if I don’t. (Actually, please comment either way!). I’ve colored a few points that I regard as particularly critical.

It was a little surprising that teams didn’t resist the underlying scenario of the game, which includes an aggressive 80% reduction from 2005 emissions by 2050. This may have been a recognition of the critical need, pointed out by Sharon Burke, to look past what is politically feasible and keep the real goal in sight (i.e. emissions that will achieve stable climate).

Continue reading “Climate War Game – Takeaways”

Climate War Game – Model Support

Drew Jones of the Sustainability Institute stumbled on a great opportunity for model-based decision support. There are lots of climate models and integrated assessment models, but they’re almost always used offline. That is, modelers work between negotiations to develop analyses that (hopefully) address decision makers’ questions, but during any given meeting, negotiators rely on their mental models and static briefing materials. It’s a bit like training pilots in a flight simulator, then having them talk on the radio to guide a novice, who flies the real plane without instruments.

Continue reading “Climate War Game – Model Support”