Washboard Evolution

Via ScienceDaily,

Just about any road with a loose surface ’” sand or gravel or snow ’” develops ripples that make driving a very shaky experience. A team of physicists from Canada, France and the United Kingdom have recreated this “washboard” phenomenon in the lab with surprising results: ripples appear even when the springy suspension of the car and the rolling shape of the wheel are eliminated. The discovery may smooth the way to designing improved suspension systems that eliminate the bumpy ride.

“The hopping of the wheel over the ripples turns out to be mathematically similar to skipping a stone over water,” says University of Toronto physicist, Stephen Morris, a member of the research team.

“To understand the washboard road effect, we tried to find the simplest instance of it, he explains. We built lab experiments in which we replaced the wheel with a suspension rolling over a road with a simple inclined plow blade, without any spring or suspension, dragging over a bed of dry sand. Ripples appear when the plow moves above a certain threshold speed.”

“We analyzed this threshold speed theoretically and found a connection to the physics of stone skipping. A skipping stone needs to go above a specific speed in order to develop enough force to be thrown off the surface of the water. A washboarding plow is quite similar; the main difference is that the sandy surface “remembers” its shape on later passes of the blade, amplifying the effect.”

The RPX is up

While the Case-Shiller index is down and the conventional wisdom suggests that housing prices will continue to fall, the RPX composite is up for the first time since 2007. The year-on-year ratio hit bottom in Feb 09. The RPX has a lot less lag than the CSI, but also a seasonal signal, so this could merely mean that seasonally adjusted prices are just falling more slowly, but it would be nice if it reflected green shoots. I’m not holding my breath though.

ABC to air Clout & Climate Change documentary

This just in from CNAS:

ABC News will air Earth 2100, the prime time documentary for which they filmed the war game, on June 2, 2009, at 9:00 p.m. (EST). You can view a promotional short report on the documentary from ABC News online, and hopefully you will all be able to view it on television or via Internet.

In conjunction with the airing of the documentary, CNAS has made the participant briefing book and materials from the game available online. We encourage other institutions to use and cite these materials to learn about the game and to stage their own scenario exercises. I also hope that they will be useful to you for your own future reference.

Finally, we are posting a short working paper of major findings from the game. While the game did not result in the kind of breakthrough agreements we all would have liked to see, this exercise achieved CNAS’s goals of exploring and highlighting the potential difficulties and opportunities of international cooperation on climate change. I know that everyone took away different observations from the game, however, and I hope that you will share your memories and your own key findings of the event with us, and allow us to post them online as a new section of the report.

Visit the Climate Change War Game webpage to view the CNAS report on major findings and background on developing the 2015 world, the participant briefing book, and materials generated from the game.

Another Look at Limits to Growth

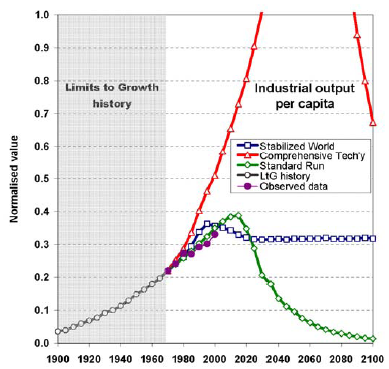
I was just trying to decide whether I believed what I said recently, that the current economic crisis is difficult to attribute to environmental unsustainability. While I was pondering, I ran across this article by Graham Turner on the LtG wiki entry, which formally compares the original Limits runs to history over the last 30+ years. A sample:

Industrial output in Limits to Growth runs vs. history

The report basically finds what I’ve argued before: that history does not discredit Limits.

Aerosols and the Climate Bathtub

From RealClimate:

Over the mid-20th century, sulfate precursor emissions appear to have been so large that they more then compensated for greenhouse gases, leading to a slight cooling in the Northern Hemisphere. During the last 3 decades, the reduction in sulfate has reversed that cooling, and allowed the effects of greenhouse gases to clearly show. In addition, black carbon aerosols lead to warming, and these have increased during the last 3 decades.

For an analogy, picture a reservoir. Say that around the 1930s, rainfall into the watershed supplying the reservoir began to increase. However, around the same time, a leak developed in the dam. The lake level stayed fairly constant as the rainfall increased at about the same rate the leak grew over the next few decades. Finally, the leak was patched (in the early 70s). Over the next few decades, the lake level increased rapidly. Now, what’s the cause of that increase? Is it fair to say that lake level went up because the leak was fixed? Remember that if the rainfall hadn’t been steadily increasing, then the leak would have led to a drop in lake levels whereas fixing it would have brought the levels back to normal. However, it’s also incomplete to ignore the leak, because then it seems puzzling that the lake levels were flat despite the increased rain during the first few decades and that, were you to compare the increased rain with the lake level rise, you’d find the rise was more rapid during the past three decades than you could explain by the rain changes during that period. You need both factors to understand what happened, as you need both greenhouse gases and aerosols to explain the surface temperature observations (and the situation is more complex than this simple analogy due to the presence of both cooling and warming types of aerosols).

Read the rest: Yet More Aerosols