A billion prices

Econbrowser has an interesting article on the Billion Prices Project, which looks for daily price movements on items across the web. This yields a price index that’s free of quality change assumptions, unlike hedonic CPI measures, but introduces some additional issues due to the lack of control over the changing portfolio of measured items.

A couple of years ago we built the analytics behind the RPX index of residential real estate prices, and grappled with many of the same problems. The competition was the CSI – the Case-Shiller indes, which uses the repeat-sales method. With that approach, every house serves as its own control, so changes in neighborhoods or other quality aspects wash out. However, the clever statistical control introduces some additional problems. First, it reduces the sample of viable data points, necessitating a 3x longer reporting lag. Second, the processing steps reduce transparency. Third, one step in particular involves downweighting of homes with (possibly implausibly) large price movements, which may have the side effect of reducing sensitivity to real extreme events. Fourth, users may want to see effects of a changing sales portfolio.

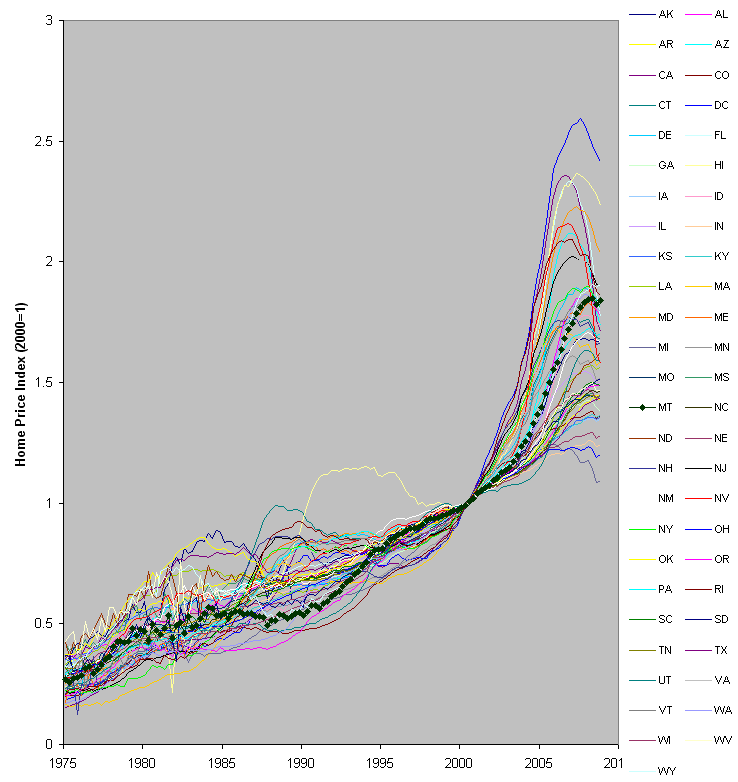
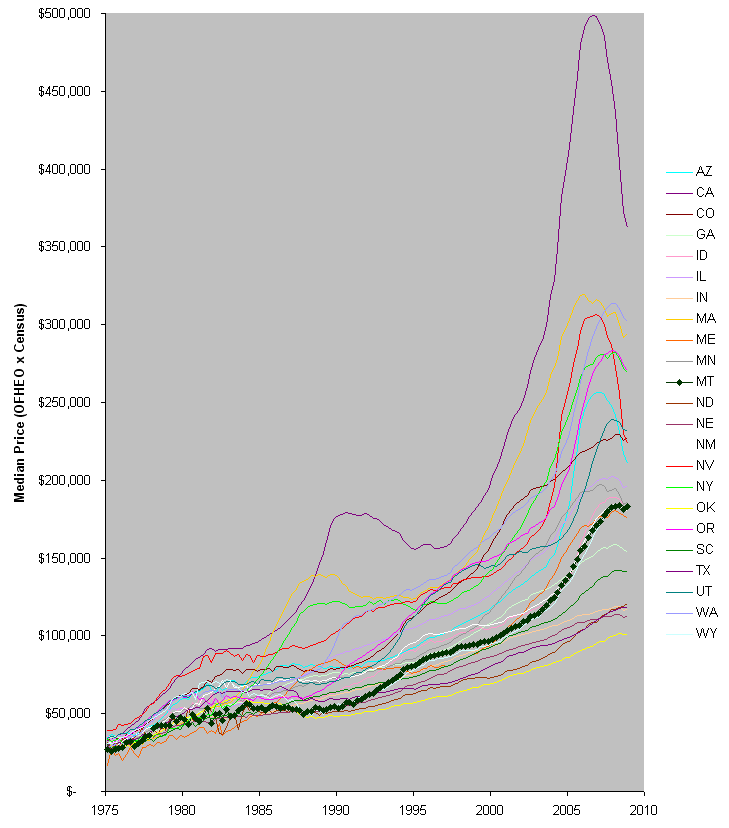
For the RPX, we chose instead a triple power law estimate, ignoring quality and mix issues entirely. The TPL is basically a robust measure of the central tendency of prices. It’s not too different from the median, except that it provides some diagnostics of data quality issues from the distribution of the tails. The payoff is a much more responsive index, which can be reported daily with a short lag. We spent a lot of time comparing the RPX to the CSI, and found that, while changes in quality and mix of sales could matter in principle, in practice the two approaches yield essentially the same answer, even over periods of years. My (biased)  inclination, therefore, is to prefer the RPX approach. Your mileage may vary.

One interesting learning for me from the RPX project was that traders don’t want models. We went in thinking that sophisticated dynamics coupled to data would be a winner. Maybe it is a winner, but people want their own sophisticated dynamics. They wanted us to provide only a datastream that maximized robustness and transparency, and minimized lag. Those are sensible design principles. But I have to wonder whether a little dynamic insight would have been useful as well since, after all, many data consumers evidently did not have an adequate model of the housing market.

The RPX is up

While the Case-Shiller index is down and the conventional wisdom suggests that housing prices will continue to fall, the RPX composite is up for the first time since 2007. The year-on-year ratio hit bottom in Feb 09. The RPX has a lot less lag than the CSI, but also a seasonal signal, so this could merely mean that seasonally adjusted prices are just falling more slowly, but it would be nice if it reflected green shoots. I’m not holding my breath though.

Can Montana Escape Recession Ravages?

The answer is evidently now “no”, but until recently the UofM’s Bureau of Business and Economic Research director Patrick Barkey thought so:

“As early as last summer we still thought Montana would escape this recession,” he said. “We knew the national economic climate was uncertain, but Montana had been doing pretty well in the previous two recessions. We now know this is a global recession, and it is a more severe recession, and it’s a recession that’s not going to leave Montana unscathed.”

Indeed, things aren’t as bad here as they are in a lot of other places – yet. Compare our housing prices to Florida’s:

MT vs FL house price indexes

On the other hand, our overall economic situation shows a bigger hit than some places with hard-hit housing markets. Here’s the Fed’s coincident index vs. California:

MT coincident index of economic activity

As one would expect, the construction and resource sectors are particularly hard hit by the double-whammy of housing bubble and commodity price collapse. In spite of home prices that seem to have held steady so far, new home construction has fallen dramatically:

MT housing

Interestingly, that hasn’t hit construction employment as hard as one would expect. Mining and resources employment has taken a similar hit, though you can hardly see it here because the industry is comparatively small (so why is its influence on MT politics comparatively large?).

MT construction & mining employment

So, where’s the bottom? For metro home prices nationwide, futures markets think it’s 10 to 20% below today, some time around the end of 2010. If the recession turns into a depression, that’s probably too rosy, and it’s hard to see how Montana could escape the contagion. But the impact will certainly vary regionally. The answer for Montana likely depends a lot on two factors: how bubbly was our housing market, and how recession-resistant is our mix of economic activity?

On the first point, here’s the Montana housing market (black diamonds), compared to the other 49 states and DC:

State home price index vs 2000

Prices above are normalized to 2000 levels, using the OFHEO index of conforming loan sales (which is not entirely representative – read on). At the end of 2003, Montana ranked 20th in appreciation from 2000. At the end of 2008, MT was 8th. Does the rise mean that we’re holding strong on fundamentals while others collapse? Or just that we’re a bunch of hicks, last to hear that the party’s over? Hard to say.

It’s perhaps a little easier to separate fundamentals from enthusiasm by looking at prices in absolute terms. Here, I’ve used the Census Bureau’s 2000 median home prices to translate the OFHEO index into $ terms:

State median home prices

Among its western region peers, a few other large states, and random states I like, Montana starts to look like a relative bargain still. The real question then is whether demographic trends (latte cowboys like me moving in) can buoy the market against an outgoing tide. I suspect that we’ll fare reasonably well in the long run, but suffer a significant undershoot in the near term.

The OFHEO indices above are a little puzzling, in that so many states seem to be just now, or not yet, peaking. For comparison, here are the 20 metro areas in the CSI index (lines), together with Gallatin County’s median prices (bars):

Gallatin County & CSI metro home prices

These more representative indices still show Montana holding up comparatively well, but with Gallatin County peaking in 2006. I suspect that the OFHEO index is a biased picture of the wider market, due to its exclusion of nonconforming loans, and that this is a truer picture.

Real Estate Roundup

Ira Artman takes a look at residential real estate price indices – S&P/Case-Shiller (CSI), OFHEO, and RPX. The RPX comes out on top, for (marginally) better correlation with foreclosures and, more importantly, a much shorter reporting lag than CSI. This is a cause for minor rejoicing, as we at Ventana helped create the RPX and are affiliated with Radar Logic. Perhaps more importantly, rumor has it that there’s more trading volume on RPX.

In spite of the lag it introduces, the CSI repeat sales regression is apparently sexy to economists. Calculated Risk has been using it to follow developments in prices and price/rent ratios. Econbrowser today looks at the market bottom, as predicted by CSI forward contracts on CME. You can find similar forward curves in Radar’s monthly analysis. As of today, both RPX and CSI futures put the bottom of the market in Nov/Dec 2010, another 15% below current prices. Interestingly, the RPX forward curve looks a little more pessimistic than CSI – an arbitrage opportunity, if you can find the liquidity.

Artman notes that somehow the Fed, in its flow of funds reporting, missed most of the housing decline until after the election.

A modest bailout proposal

The Fed has just doled out over $300 billion in loans to bail out Bear Stearns and other bad actors in the subprime mortgage mess. It’s hard to say what fraction of that capital is really at risk, but let’s say 10%. That’s a pretty big transfer to shareholders, especially considering that there’s nothing in it for the general public other than avoidance of financial contagion effects. If this were an environmental or public health issue, skeptics would be lined up to question whether contagion in fact exists, whether fixing it does more harm than good (e.g., by creating future moral hazard), and whether there’s a better way to spend the money. Contagion would have to be proven with models, subject to infinite scrutiny and delay. Yet here, billions are doled out with no visible analysis or public process, based on policies invented ad hoc. Perhaps a little feedback control is needed here: let’s create a bailout fund, supported by taxes on firms that are deemed too big to fail by some objective criteria. Then two negative feedbacks will operate: firms that get too large will be encouraged to split themselves into manageable chunks, and the potential beneficiaries of bailouts will have to ask themselves how badly they really want insurance. Let’s try it, and see how long the precautionary principle lasts in the financial sector.

Update: Paul Krugman has a nice editorial on the problem.

And if financial players like Bear are going to receive the kind of rescue previously limited to deposit-taking banks, the implication seems obvious: they should be regulated like banks, too.