Pindyck on Integrated Assessment Models

Economist Robert Pindyck takes a dim view of the state of integrated assessment modeling:

Climate Change Policy: What Do the Models Tell Us?

Robert S. Pindyck

NBER Working Paper No. 19244

Issued in July 2013

Very little. A plethora of integrated assessment models (IAMs) have been constructed and used to estimate the social cost of carbon (SCC) and evaluate alternative abatement policies. These models have crucial flaws that make them close to useless as tools for policy analysis: certain inputs (e.g. the discount rate) are arbitrary, but have huge effects on the SCC estimates the models produce; the models’ descriptions of the impact of climate change are completely ad hoc, with no theoretical or empirical foundation; and the models can tell us nothing about the most important driver of the SCC, the possibility of a catastrophic climate outcome. IAM-based analyses of climate policy create a perception of knowledge and precision, but that perception is illusory and misleading.

Freepers seem to think that this means the whole SCC enterprise is GIGO. But this is not a case where uncertainty is your friend. Bear in mind that the deficiencies Pindyck discusses, discounting welfare and ignoring extreme outcomes, create a one-sided bias toward a SCC that is too low. Zero (the de facto internalized SCC in most places) is one number that’s virtually certain to be wrong.

Tasty Menu

From the WPI online graduate program and courses in system dynamics:

Truly a fine lineup!

Population Growth Up

According to Worldwatch, there’s been an upward revision in UN population projections. As things now stand, the end-of-century tally settles out just short of 11 billion (medium forecast of 10.9 billion, with a range of 6.8 to 16.6).

The change is due to higher than expected fertility:

Compared to the UN’s previous assessment of world p opulation trends, the new projected total population is higher, particularly after 2075. Part of the reason is that current fertility levels have been adjusted upward in a number of countries as new information has become available. In 15 high-fertil ity countries of sub-Saharan Africa, the estimated average number of children pe r woman has been adjusted upwards by more than 5 per cent.

The projections are essentially open loop with respect to major environmental or other driving forces, so the scenario range doesn’t reflect full uncertainty. Interestingly, the UN varies fertility but not mortality in projections. Small differences in fertility make big differences in population:

The “high-variant” projection, for example, which assumes an extra half of a child per woman (on average) than the medium variant, implies a world population of 10.9 billion in 2050. The “low-variant” projection, where women, on average, have half a child less than under the medium variant, would produce a population of 8.3 billion in 2050. Thus, a constant difference of only half a child above or below the medium variant would result in a global population of around 1.3 billion more or less in 2050 compared to the medium-variant forecast.

There’s a nice backgrounder on population projections, by Brian O’Neil et al., in Demographic Research. See Fig. 6 for a comparison of projections.

Flow down, stock up

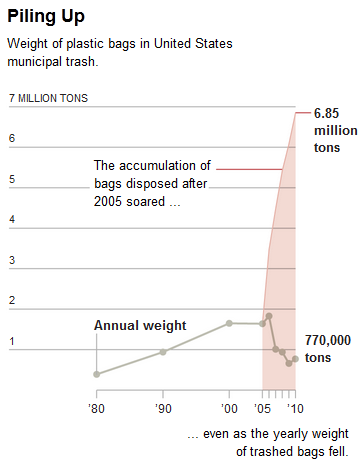
A simple example of bathtub dynamics:

Source: NYT

The flow of plastic bags into landfills is dramatically down from the 2005 rate. But the accumulation is up. This should be no surprise, because the structure of this system is:

The accumulation of bags in the landfill can only go up, because it has no outflow (though in reality there’s presumably some very slow rate of degradation). The integration in the stock renders intuitive pattern matching (flow down->stock down) incorrect.

Placing the flow and the stock on the same vertical scale, is also a bit misleading, because they’re apples and oranges – the flow of disposal has units of tons/year, while the accumulation has units of tons.

Also, initializing the stock to its 2005 value is a bit weird. If you integrate the disposal flow from 1980 (interpolating as needed), the accumulation is much more dramatic: about 36 million tons, by my eyeball.

Blood pressure regulation

The Tech Review Arxiv blog has a neat summary of new research on high blood pressure. It turns out that the culprit may be a feedback mechanism that can’t adequately respond to stiffening of the arteries with age:

The human body has a well understood mechanism for monitoring blood pressure changes, consisting of sensors embedded in the major arterial walls that monitor changes in pressure and then trigger other changes in the body to increase or reduce the pressure as necessary, such as the regulation of the volume of fluid in the blood vessels. This is known as the baroreceptor reflex.

So an interesting question is why this system does not respond appropriately as the body ages. Why, for example, does this system not reduce the volume of fluid in the blood to decrease the pressure when it senses a high systolic pressure in an elderly person?

The theory that Pettersen and co have tested is that the sensors in the arterial walls do not directly measure pressure but instead measure strain, that is the deformation of the arterial walls.

As these walls stiffen due to the natural ageing process, the sensors become less able to monitors changes in pressure and therefore less able to compensate.