The dynamics of UFO sightings

The Economist reports on UFO sightings:

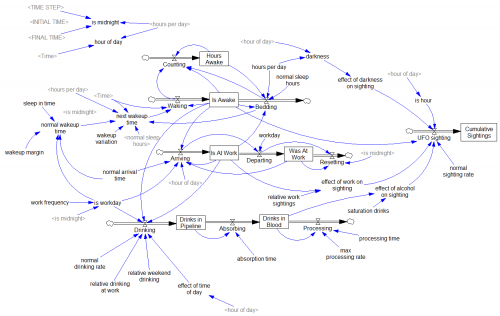
UFOdataThis deserves a model:

UFOs

UFOs.vpm (Vensim published model, requires Pro/DSS or the free Reader)

The model is a mixed discrete/continuous simulation of an individual sleeping, working and drinking. This started out as a multi-agent model, but I realized along the way that sleeping, working and drinking is a fairly ergodic process on long time scales (at least with respect to UFOs), so one individual with a distribution of behaviors over time or simulations is as good as a population of agents.

The model replicates the data somewhat faithfully:

UFOdistributionThe model shows a morning peak (people awake but out and about) and a workday dip (inside, lurking near the water cooler) but the data do not. This suggests to me that:

  • Alcohol is the dominant factor in sightings.
  • I don’t party nearly enough to see a UFO.

Actually, now that I’ve built this version, I think the interesting model would have a longer time horizon, to address the non-ergodic part: contagion of sightings across individuals.

h/t Andreas Größler.

Flow down, stock up

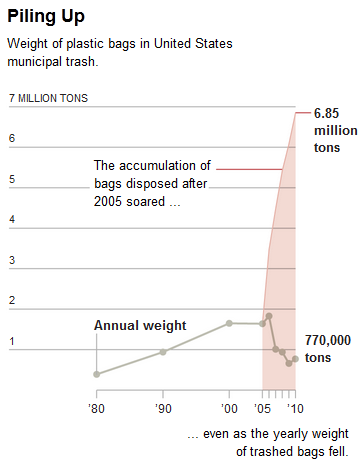
A simple example of bathtub dynamics:

Source: NYT

The flow of plastic bags into landfills is dramatically down from the 2005 rate. But the accumulation is up. This should be no surprise, because the structure of this system is:

The accumulation of bags in the landfill can only go up, because it has no outflow (though in reality there’s presumably some very slow rate of degradation). The integration in the stock renders intuitive pattern matching (flow down->stock down) incorrect.

Placing the flow and the stock on the same vertical scale, is also a bit misleading, because they’re apples and oranges – the flow of disposal has units of tons/year, while the accumulation has units of tons.

Also, initializing the stock to its 2005 value is a bit weird. If you integrate the disposal flow from 1980 (interpolating as needed), the accumulation is much more dramatic: about 36 million tons, by my eyeball.

Blood pressure regulation

The Tech Review Arxiv blog has a neat summary of new research on high blood pressure. It turns out that the culprit may be a feedback mechanism that can’t adequately respond to stiffening of the arteries with age:

The human body has a well understood mechanism for monitoring blood pressure changes, consisting of sensors embedded in the major arterial walls that monitor changes in pressure and then trigger other changes in the body to increase or reduce the pressure as necessary, such as the regulation of the volume of fluid in the blood vessels. This is known as the baroreceptor reflex.

So an interesting question is why this system does not respond appropriately as the body ages. Why, for example, does this system not reduce the volume of fluid in the blood to decrease the pressure when it senses a high systolic pressure in an elderly person?

The theory that Pettersen and co have tested is that the sensors in the arterial walls do not directly measure pressure but instead measure strain, that is the deformation of the arterial walls.

As these walls stiffen due to the natural ageing process, the sensors become less able to monitors changes in pressure and therefore less able to compensate.

Circling the Drain

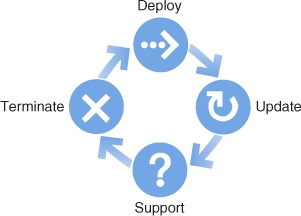
“It’s Time to Retire ‘Crap Circles’,” argues Gardiner Morse in the HBR. I wholeheartedly agree. He’s assembled a lovely collection of examples. Some violate causality amusingly:

“Through some trick of causality, termination leads to deployment.”

Morse ridicules one diagram that actually shows an important process,

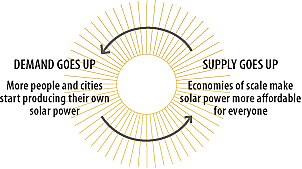
The friendly-looking sunburst that follows, captured from the website of a solar energy advocacy group, shows how to create an unlimited market for your product. Here, as the supply of solar energy increases, so does the demand — in an apparently endless cycle. If these folks are right, we’re all in the wrong business.

This is not a particularly well-executed diagram, but the positive feedback process (reinforcing loop) of increasing demand driving economies of scale, lowering costs and further increasing demand, is real. Obviously there are other negative loops that restrain this one from delivering infinite solar, but not every diagram needs to show every loop in a system.

Unfortunately, Morse’s prescription, “We could all benefit from a little more linear thinking,” is nearly as alarming as the illness. The vacuous linear processes are right there next to the cycles in PowerPoint’s Smart Art:

Linear thinking isn’t a get-out-of-chartjunk-free card. It’s an invitation to event-driven unidirectional causal thinking, laundry lists, and George Richardson’s Dead Buffalo Syndrome. What we really need is more understanding of causality and feedback, and more operational thinking, so that people draw meaningful graphics, employing cycles where they appropriately describe causality.

h/t John Sterman for pointing this out.

Positive feedback drives email list meltdown

I’m on an obscure email list for a statistical downscaling model. I think I’ve gotten about 10 messages in the last two years. But today, that changed.
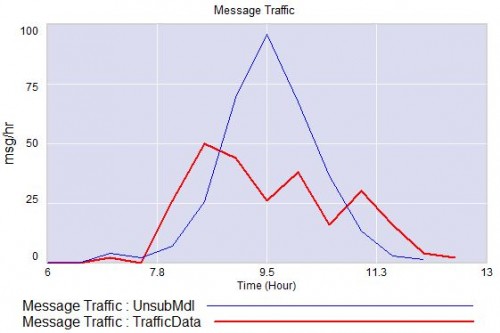
List traffic (data in red).

Around 7 am, there were a couple of innocuous, topical messages. That prompted someone who’d evidently long forgotten about the list to send an “unsubscribe me” message to the whole list. (Why people can’t figure out that such missives are both ineffective and poor list etiquette is beyond me.) That unleashed a latent vicious cycle: monkey-see, monkey-do produced a few more “unsub” messages. Soon the traffic level became obnoxious, spawning more and more ineffectual unsubs. Then, the brakes kicked in, as more sensible users appealed to people to quit replying to the whole list. Those messages were largely lost in the sea of useless unsubs, and contributed to the overall impression that things were out of control.

People got testy:

I will reply to all to make my point.

Has it occurred to any of you idiots to just reply to Xxxx Xxxx rather than hitting reply to all. Come on already, this is not rocket science here. One person made the mistake and then you all continue to repeat it.

By about 11, the fire was slowing, evidently having run out of fuel (list ignoramuses), and someone probably shut it down by noon – but not before at least a hundred unsubs had flown by.

Just for kicks, I counted the messages and put together a rough-cut Vensim model of this little boom-bust cycle:
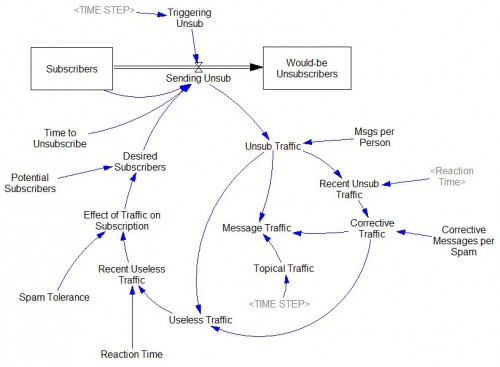
unsub.mdl unsub.vpm

This is essentially the same structure as the Bass Diffusion model, with a few refinements. I think I didn’t quite capture the unsubscriber behavior. Here, I assume that would-be unsubscribers, who think they’ve left the list but haven’t, at least quit sending messages. In reality, they didn’t – in blissful ignorance of what was going on, several sent multiple requests to be unsubscribed. I didn’t explicitly represent the braking effect (if any) of corrective comments. Also, the time constants for corrections and unsubscriptions could probably be separated. But it has the basics – a positive feedback loop driving growth in messages, and a negative feedback loop putting an end to the growth. Anyway, have fun with it.

Computing and networks have solved a lot of problems, like making logistics pipelines visible, but they’ve created as many new ones. The need for models to improve intuition and manage new problems is as great as ever.

The model that ate Europe is back, and it's bigger than ever

The FuturICT Knowledge Accelerator, a grand unified model of everything, is back in the news.

What if global scale computing facilities were available that could analyse most of the data available in the world? What insights could scientists gain about the way society functions? What new laws of nature would be revealed? Could society discover a more sustainable way of living? Developing planetary scale computing facilities that could deliver answers to such questions is the long term goal of FuturICT.

I’ve been rather critical of this effort before, but I think there’s also much to like.

  • An infrastructure for curated public data would be extremely useful.
  • There’s much to be gained through a multidisciplinary focus on simulation, which is increasingly essential and central to all fields.
  • Providing a public portal into the system could have valuable educational benefits.
  • Creating more modelers, and more sophisticated model users, helps build capacity for science-based self governance.

But I still think the value of the project is more about creating an infrastructure, within which interesting models can emerge, than it is in creating an oracle that decision makers and their constituents will consult for answers to life’s pressing problems.

  • Even with Twitter and Google, usable data spans only a small portion of human existence.
  • We’re not even close to having all the needed theory to go with the data. Consider that general equilibrium is the dominant modeling paradigm in economics, yet equilibrium is not a prevalent feature of reality.
  • Combinatorial explosion can overwhelm any increase in computing power for the foreseeable future, so the very idea of simulating everything social and physical at once is laughable.
  • Even if the technical hurdles can be overcome,
    • People are apparently happy to hold beliefs that are refuted by the facts, as long as buffering stocks afford them the luxury of a persistent gap between reality and mental models.
    • Decision makers are unlikely to cede control to models that they don’t understand or can’t manipulate to generate desired results.

I don’t think you need to look any further than the climate debate and the history of Limits to Growth to conclude that models are a long way from catalyzing a sustainable world.

If I had a billion Euros to spend on modeling, I think less of it would go into a single platform and more would go into distributed efforts that are working incrementally. It’s easier to evolve a planetary computing platform than to design one.

With the increasing accessibility of computing and visualization, we could be on the verge of a model-induced renaissance. Or, we could be on the verge of an explosion of fun and pretty but vacuous, non-transparent and unvalidated model rubbish that lends itself more to propaganda than thinking. So, I’d be plowing a BIG chunk of that billion into infrastructure and incentives for model and data quality.

Sandpiles & Systems

Sand piles are sometimes used as a counterpoint to systems, where a system is a bunch of interconnected components that interact in some interesting way, while a sand pile is just a bunch of boring stuff. Ironically, sand piles are actually pretty interesting – they self organize. Avalanches regulate the angle of repose of the pile. In aggregate, one can think of this as a negative feedback process – when the pile is too steep, it avalanches, building up the base and lowering the top. There’s more to the picture when you look at it from a disaggregate perspective; the resulting state is an example of self-organized criticality, and if you keep adding to the pile, you get avalanches at all scales (i.e. a power law distribution).

Overnight, nature left me a nice example of a snow pile system on our front stair railing. At some point, the accumulated snow on the handrail partially avalanched, leaving bare wood on its lower half. Evidently the railing is at just the right angle for the ongoing snowfall, fine grains due to the cold, to make a kind of cellular automaton, resulting in this surprisingly regular pattern, reminiscent of a Sierpinski triangle or one of Wolfram’s elementary systems.