Spot the health care smokescreen

A Tea Party presentation on health care making the rounds in Montana claims that life expectancy is a smoke screen, and it’s death rates we should be looking at. The implication is that we shouldn’t envy Japan’s longer life expectancy, because the US has lower death rates, indicating superior performance of our health care system.

Which metric really makes the most sense from a systems perspective?

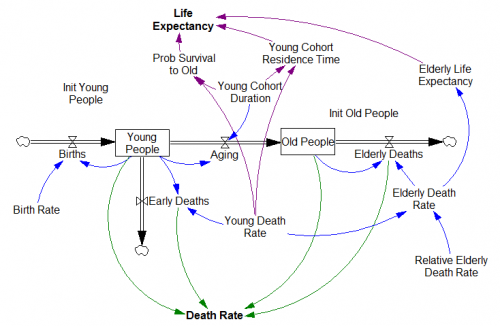
Here’s a simple, 2nd order model of life and death:

From the structure, you can immediately observe something important: life expectancy is a function only of parameters, while the death rate also includes the system states. In other words, life expectancy reflects the expected life trajectory of a person, given structure and parameters, while the aggregate death rate weights parameters (cohort death rates) by the system state (the distribution of population between old and young).

In the long run, the two metrics tell you the same thing, because the system comes into equilibrium such that the death rate is the inverse of the life expectancy. But people live a long time, so it might take decades or even centuries to achieve that equilibrium. In the meantime, the death rate can take on any value between the death rates of the young and old cohorts, which is not really helpful for understanding what a new person can expect out of life.

So, to the extent that health care performance is visible in the system trajectory at all, and not confounded by lifestyle choices, life expectancy is the metric that tells you about performance, and the aggregate death rate is the smokescreen.

Here’s the model: LifeExpectancyDeathRate.mdl or LifeExpectancyDeathRate.vpm

It’s initialized in equilibrium. You can explore disequilbrium situations by varying the initial population distribution (Init Young People & Init Old People), or testing step changes in the death rates.

What a real breakthrough might look like

It’s possible that a techno fix will stave off global limits indefinitely, in a Star Trek future scenario. I think it’s a bad idea to rely on it, because there’s no backup plan.

But it’s equally naive to think that we can return to some kind of low-tech golden age. There are too many people to feed and house, and those bygone eras look pretty ugly when you peer under the mask.

But this is a false dichotomy.

Some techno/growth enthusiasts talk about sustainability as if it consisted entirely of atavistic agrarian aspirations. But what a lot of sustainability advocates are after, myself included, is a high-tech future that operates within certain material limits (planetary boundaries, if you will) before those limits enforce themselves in nastier ways. That’s not really too hard to imagine; we already have a high tech economy that operates within limits like the laws of motion and gravity. Gravity takes care of itself, because it’s instantaneous. Stock pollutants and resources don’t, because consequences are remote in time and space from actions; hence the need for coordination. Continue reading “What a real breakthrough might look like”

Et tu, Groupon?

Is Groupon overvalued too? Modeling Groupon actually proved a bit more challenging than my last post on Facebook.

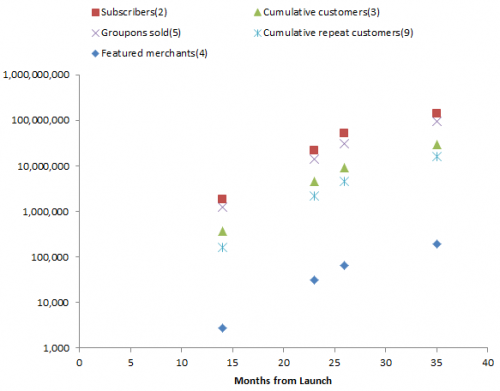
Again, I followed in the footsteps of Cauwels & Sornette, starting with the SEC filing data they used, with an update via google. C&S fit a logistic to Groupon’s cumulative repeat sales. That’s actually the end of a cascade of participation metrics, all of which show logistic growth:

The variable of greatest interest with respect to revenue is Groupons sold. But the others also play a role in determining costs – it takes money to acquire and retain customers. Also, there are actually two populations growing logistically – users and merchants. Growth is presumably a function of the interaction between these two populations. The attractiveness of Groupon to customers depends on having good deals on offer, and the attractiveness to merchants depends on having a large customer pool.

I decided to start with the customer side. The customer supply chain looks something like this:

Subscribers data includes all three stocks, cumulative customers is the right two, and cumulative repeat customers is just the rightmost.

Continue reading “Et tu, Groupon?”

Time to short some social network stocks?

I don’t want to wallow too long in metaphors, so here’s something with a few equations.

A recent arXiv paper by Peter Cauwels and Didier Sornette examines market projections for Facebook and Groupon, and concludes that they’re wildly overvalued.

We present a novel methodology to determine the fundamental value of firms in the social-networking sector based on two ingredients: (i) revenues and profits are inherently linked to its user basis through a direct channel that has no equivalent in other sectors; (ii) the growth of the number of users can be calibrated with standard logistic growth models and allows for reliable extrapolations of the size of the business at long time horizons. We illustrate the methodology with a detailed analysis of facebook, one of the biggest of the social-media giants. There is a clear signature of a change of regime that occurred in 2010 on the growth of the number of users, from a pure exponential behavior (a paradigm for unlimited growth) to a logistic function with asymptotic plateau (a paradigm for growth in competition). […] According to our methodology, this would imply that facebook would need to increase its profit per user before the IPO by a factor of 3 to 6 in the base case scenario, 2.5 to 5 in the high growth scenario and 1.5 to 3 in the extreme growth scenario in order to meet the current, widespread, high expectations. […]

I’d argue that the basic approach, fitting a logistic to the customer base growth trajectory and multiplying by expected revenue per customer, is actually pretty ancient by modeling standards. (Most system dynamicists will be familiar with corporate growth models based on the mathematically-equivalent Bass diffusion model, for example.) So the surprise for me here is not the method, but that forecasters aren’t using it.

Looking around at some forecasts, it’s hard to say what forecasters are actually doing. There’s lots of handwaving and blather about multipliers, and little revelation of actual assumptions (unlike the paper). It appears to me that a lot of forecasters are counting on big growth in revenue per user, and not really thinking deeply about the user population at all.

To satisfy my curiosity, I grabbed the data out of Cauwels & Sornette, updated it with the latest user count and revenue projection, and repeated the logistic model analysis. A few observations:

I used a generalized logistic, which has one more parameter, capturing possible nonlinearity in the decline of the growth rate of users with increasing saturation of the market. Here’s the core model:

Continue reading “Time to short some social network stocks?”

Models and metaphors

My last post about metaphors ruffled a few feathers. I was a bit surprised, because I thought it was pretty obvious that metaphors, like models, have their limits.

The title was just a riff on the old George Box quote, “all models are wrong, some are useful.” People LOVE to throw that around. I once attended an annoying meeting where one person said it at least half a dozen times in the space of two hours. I heard it in three separate sessions at STIA (which was fine).

I get nervous when I hear, in close succession, about the limits of formal mathematical models and the glorious attributes of metaphors. Sure, a metaphor (using the term loosely, to include similes and analogies) can be an efficient vehicle for conveying meaning, and might lend itself to serving as an icon in some kind of visualization. But there are several possible failure modes:

  • The mapping of the metaphor from its literal domain to the concept of interest may be faulty (a bathtub vs. a true exponential decay process).
  • The point of the mapping may be missed. (If I compare my organization to the Three Little Pigs, does that mean I’ve built a house of brick, or that there are a lot of wolves out there, or we’re pigs, or … ?)
  • Listeners may get the point, but draw unintended policy conclusions. (Do black swans mean I’m not responsible for disasters, or that I should have been more prepared for outliers?)

These are not all that different from problems with models, which shouldn’t really come as a surprise, because a model is just a special kind of metaphor – a mapping from an abstract domain (a set of equations) to a situation of interest – and neither a model nor a metaphor is the real system.

Models and other metaphors have distinct strengths and weaknesses though. Metaphors are efficient, cheap, and speak to people in natural language. They can nicely combine system structure and behavior. But that comes at a price of ambiguity. A formal model is unambiguous, and therefore easy to test, but potentially expensive to build and difficult to share with people who don’t speak math. The specificity of a model is powerful, but also opens up opportunities for completely missing the point (e.g., building a great model of the physics of a situation when the crux of the problem is actually emotional).

I’m particularly interested in models for their unique ability to generate reliable predictions about behavior from structure and to facilitate comparison with data (using the term broadly, to include more than just the tiny subset of reality that’s available in time series). For example, if I argue that the number of facebook accounts grows logistically, according to dx/dt=r*x*(k-x) for a certain r, k and x(0), we can agree on exactly what that means. Even better, we can estimate r and k from data, and then check later to verify that the model was correct. Try that with “all the world’s a stage.”

If you only have metaphors, you have to be content with not solving a certain class of problems. Consider climate change. I say it’s a bathtub, you say it’s a Random Walk Down Wall Street. To some extent, each is true, and each is false. But there’s simply no way to establish which processes dominate accumulation of heat and endogenous variability, or to predict the outcome of an experiment like doubling CO2, by verbal or visual analogy. It’s essential to introduce some math and data.

Models alone won’t solve our problems either, because they don’t speak to enough people, and we don’t have models for the full range of human concerns. However, I’d argue that we’re already drowning in metaphors, including useless ones (like “the war on [insert favorite topic]”), and in dire need of models and model literacy to tackle our thornier problems.

Forest Cover Tipping Points

There’s an interesting discussion of forest tipping points in a new paper in Science:

Global Resilience of Tropical Forest and Savanna to Critical Transitions

Marina Hirota, Milena Holmgren, Egbert H. Van Nes, Marten Scheffer

It has been suggested that tropical forest and savanna could represent alternative stable states, implying critical transitions at tipping points in response to altered climate or other drivers. So far, evidence for this idea has remained elusive, and integrated climate models assume smooth vegetation responses. We analyzed data on the distribution of tree cover in Africa, Australia, and South America to reveal strong evidence for the existence of three distinct attractors: forest, savanna, and a treeless state. Empirical reconstruction of the basins of attraction indicates that the resilience of the states varies in a universal way with precipitation. These results allow the identification of regions where forest or savanna may most easily tip into an alternative state, and they pave the way to a new generation of coupled climate models.

Science 14 October 2011

The paper is worth a read. It doesn’t present an explicit simulation model, but it does describe the concept nicely. The basic observation is that there’s clustering in the distribution of forest cover vs. precipitation:

Hirota et al., Science 14 October 2011

In the normal regression mindset, you’d observe that some places with 2m rainfall are savannas, and others are forests, and go looking for other explanatory variables (soil, latitude, …) that explain the difference. You might learn something, or you might get into trouble if forest cover is not-only nonlinear in various inputs, but state-dependent. The authors pursue the latter thought: that there may be multiple stable states for forest cover at a given level of precipitation.

They use the precipitation-forest cover distribution and the observation that, in a first-order system subject to noise, the distribution of observed forest cover reveals something about the potential function for forest cover. Using kernel smoothing, they reconstruct the forest potential functions for various levels of precipitation:
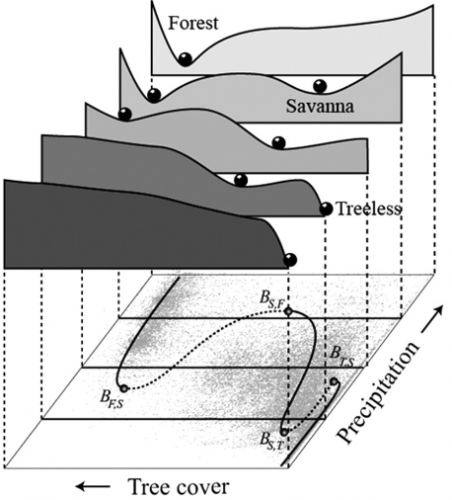
Hirota et al., Science 14 October 2011

I thought that looked fun to play with, so I built a little model that qualitatively captures the dynamics:

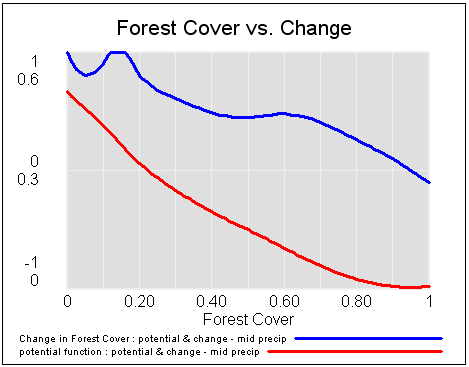
The tricky part was reconstructing the potential function without the data. It turned out to be easier to write the rate equation for forest cover change at medium precipitation (“change function” in the model), and then tilt it with an added term when precipitation is high or low. Then the potential function is reconstructed from its relationship to the derivative, dz/dt = f(z) = -dV/dz, where z is forest cover and V is the potential.

That yields the following potentials and vector fields (rates of change) at low, medium and high precipitation:
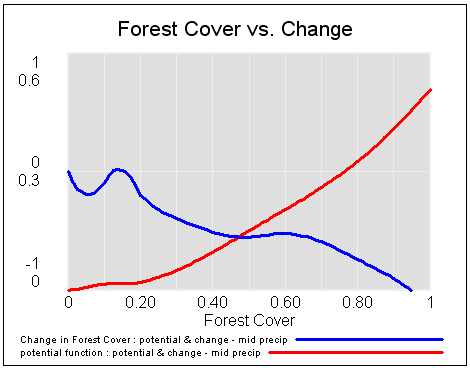
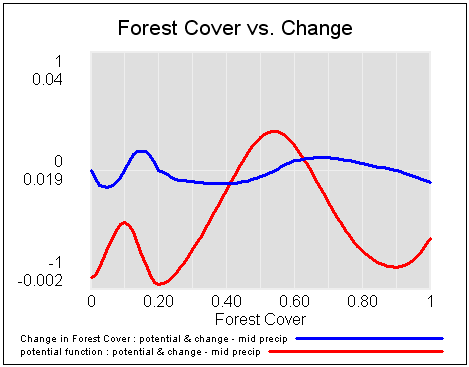
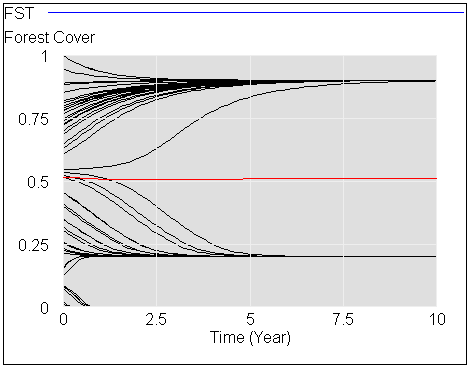
If you start this system at different levels of forest cover, for medium precipitation, you can see the three stable attractors at zero trees, savanna (20% tree cover) and forest (90% tree cover).
If you start with a stable forest, and a bit of noise, then gradually reduce precipitation, you can see that the forest response is not smooth.
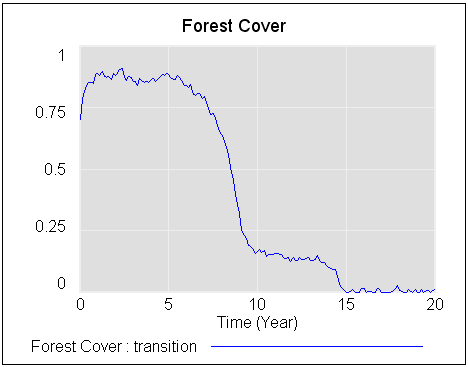
The forest is stable until about year 8, then transitions abruptly to savanna. Finally, around year 14, the savanna disappears and is replaced by a treeless state. The forest doesn’t transition to savanna until the precipitation index reaches about .3, even though savanna becomes the more stable of the two states much sooner, at precipitation of about .55. And, while the savanna state doesn’t become entirely unstable at low precipitation, noise carries the system over the threshold to the lower-potential treeless state.

The net result is that thinking about such a system from a static, linear perspective will get you into trouble. And, if you live around such a system, subject to a changing climate, transitions could be abrupt and surprising (fire might be one tipping mechanism).

The model is in my library.

Your gut may be leading you astray

An interesting comment on rationality and conservatism:

I think Sarah Palin is indeed a Rorschach test for Conservatives, but it’s about much than manners or players vs. kibbitzes – it’s about what Conservativsm MEANS.

The core idea behind Conservatism is that most of human learning is done not by rational theorizing, but by pattern recognition. Our brain processes huge amounts of data every second, and most information we get out of it is in the form of recognized patterns, not fully logical theories. It’s fair to say that 90% of our knowledge is in patterns, not in theories.

This pattern recognition is called common sense, and over generations, it’s called traditions, conventions etc. Religion is usually a carrier meme for these evolved patterns. It’s sort of an evolutionary process, like a genetic algorithm.

Liberals, Lefties and even many Libertarians want to use only 10% of the human knowledge that’s rational. And because our rational knowledge cannot yet fully explain neither human nature in itself nor everything that happens in society, they fill the holes with myths like that everybody is born good and only society makes people bad etc.

Conservatives are practical people who instinctively recognize the importance of evolved patterns in human learning: because our rational knowledge simply isn’t enough yet, these common sense patterns are our second best option to use. And to use these patterns effectively you don’t particularly have to be very smart i.e. very rational. You have to be _wise_ and you have to have a good character: you have to set hubris and pride aside and be able to accept traditions you don’t fully understand.

Thus, for a Conservative, while smartness never hurts, being wise and having a good character is more important than being very smart. Looking a bit simple simply isn’t a problem, you still have that 90% of knowledge at hand.

Anti-Palin Conservatives don’t understand it. They think Conservativism is about having different theories than the Left, they don’t understand that it’s that theories and rational knowledge isn’t so important.

(via Rabbett Run)

A possible example of the writer’s perspective at work is provided by survey research showing that Tea Partiers are skeptical of anthropogenic climate change (established by models) but receptive to natural variation (vaguely, patterns), and they’re confident that they’re well-informed about it in spite of evidence to the contrary. Another possible data point is conservapedia’s resistance to relativity, which is essentially a model that contradicts our Newtonian common sense.

As an empirical observation, this definition of conservatism seems plausible at first. Humans are fabulous pattern recognizers. And, there are some notable shortcomings to rational theorizing. However, as a normative statement – that conservatism is better because of the 90%/10% ratio, I think it’s seriously flawed.

The quality of the 90% is quite different from the quality of the 10%. Theories are the accumulation of a lot of patterns put into a formal framework that has been shared and tested, which at least makes it easy to identify the theories that fall short. Common sense, or wisdom or whatever you want to call it, is much more problematic. Everyone knows the world is flat, right?

Sadly, there’s abundant evidence that our evolved heuristics fall short in complex systems. Pattern matching in particular falls short even in simple bathtub systems. Inappropriate mental models and heuristics can lead to decisions that are exactly the opposite of good management, even when property rights are complete; noise only makes things worse.

Real common sense would have the brains to abdicate when faced with situations, like relativity or climate change, where it was clear that experience (low velocities, local weather) doesn’t provide any patterns that are relevant to the conditions under consideration.

After some reflection, I think there’s more than pattern recognition to conservatism. Liberals, anarchists, etc. are also pattern matchers. We all have our own stylized facts and conventional wisdom, all of which are subject to the same sorts of cognitive biases. So, pattern matching doesn’t automatically lead to conservatism. Many conservatives don’t believe in global warming because they don’t trust models, yet observed warming and successful predictions of models from the 70s (i.e. patterns) also don’t count. So, conservatives don’t automatically respond to patterns either.

In any case, running the world by pattern recognition alone is essentially driving by looking in the rearview mirror. If you want to do better, i.e. to make good decisions at turning points or novel conditions, you need a model.


Elk, wolves and dynamic system visualization

Bret Victor’s video of a slick iPad app for interactive visualization of the Lotka-Voltera equations has been making the rounds:

Coincidentally, this came to my notice around the same time that I got interested in the debate over wolf reintroduction here in Montana. Even simple models say interesting things about wolf-elk dynamics, which I’ll write about some other time (I need to get vaccinated for rabies first).

To ponder the implications of the video and predator-prey dynamics, I built a version of the Lotka-Voltera model in Vensim.

After a second look at the video, I still think it’s excellent. Victor’s two design principles, ubiquitous visualization and in-context manipulation, are powerful for communicating a model. Some aspects of what’s shown have been in Vensim since the introduction of SyntheSim a few years ago, though with less Tufte/iPad sexiness. But other features, like Causal Tracing, are not so easily discovered – they’re effective for pros, but not new users. The way controls appear at one’s fingertips in the iPad app is very elegant. The “sweep” mode is also clever, so I implemented a similar approach (randomized initial conditions across an array dimension) in my version of the model. My favorite trick, though, is the 2D control of initial conditions via the phase diagram, which makes discovery of the system’s equilibrium easy.

The slickness of the video has led some to wonder whether existing SD tools are dinosaurs. From a design standpoint, I’d agree in some respects, but I think SD has also developed many practices – only partially embodied in tools – that address learning gaps that aren’t directly tackled by the app in the video: Continue reading “Elk, wolves and dynamic system visualization”

Bad data, bad models

Baseline Scenario has a nice post on bad data:

To make a vast generalization, we live in a society where quantitative data are becoming more and more important. Some of this is because of the vast increase in the availability of data, which is itself largely due to computers. Some is because of the vast increase in the capacity to process data, which is also largely due to computers. …

But this comes with a problem. The problem is that we do not currently collect and scrub good enough data to support this recent fascination with numbers, and on top of that our brains are not wired to understand data. And if you have a lot riding on bad data that is poorly understood, then people will distort the data or find other ways to game the system to their advantage.

In spite of ubiquitous enterprise computing, bad data is the norm in my experience with corporate consulting. At one company, I had access to very extensive data on product pricing, promotion, advertising, placement, etc., but the information system archived everything inaccessibly on a rolling 3-year horizon. That made it impossible to see long term dynamics of brand equity, which was really the most fundamental driver of the firm’s success. Our experience with large projects includes instances where managers don’t want to know the true state of the system, and therefore refuse to collect or provide needed data – even when billions are at stake. And some firms jealously guard data within stovepipes – it’s hard to optimize the system when the finance group keeps the true product revenue stream secret in order to retain leverage over the marketing group.

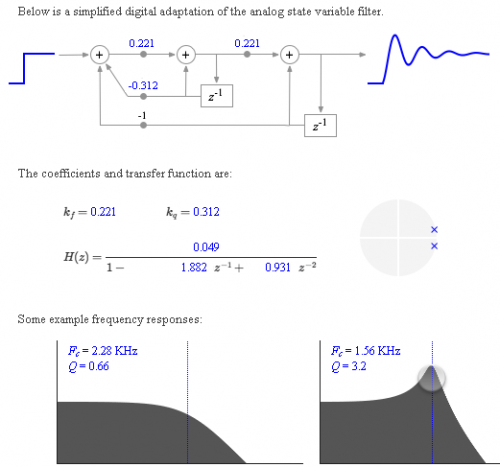
People worry about garbage-in-garbage out, but modeling can actually be the antidote to bad data. If you pay attention to quality, the process of building a model will reveal all kinds of gaps in data. We recently discovered that various sources of vehicle fleet data are in serious disagreement, because of double-counting of transactions and interstate sales, and undercounting of inspections. Once data issues are known, a model can be used to remove biases and filter noise (your GPS probably runs a Kalman Filter to combine a simple physical model of your trajectory with noisy satellite measurements).

Not just any model will do; causal models are important. It’s hard to discover that your data fails to observe physical laws or other reality checks with a model that permits negative cows and buries the acceleration of gravity in a regression coefficient.

The problem is, a lot of people have developed an immune response against models, because there are so many that don’t pay attention to quality and serve primarily propagandistic purposes. The only antidote for that, I think, is to teach modeling skills, or at least model consumption skills, so that they know the right questions to ask in order to separate the babies from the bathwater.