Bret Victor’s video of a slick iPad app for interactive visualization of the Lotka-Voltera equations has been making the rounds:
Coincidentally, this came to my notice around the same time that I got interested in the debate over wolf reintroduction here in Montana. Even simple models say interesting things about wolf-elk dynamics, which I’ll write about some other time (I need to get vaccinated for rabies first).
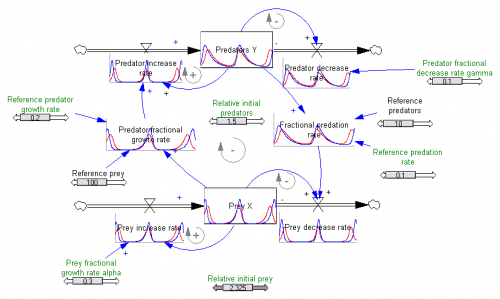
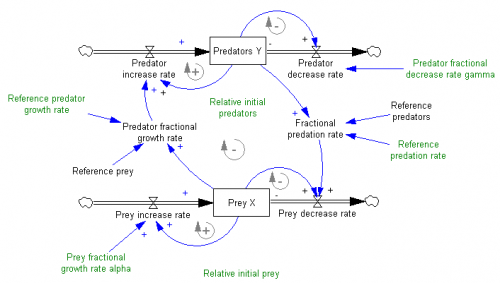
To ponder the implications of the video and predator-prey dynamics, I built a version of the Lotka-Voltera model in Vensim.
After a second look at the video, I still think it’s excellent. Victor’s two design principles, ubiquitous visualization and in-context manipulation, are powerful for communicating a model. Some aspects of what’s shown have been in Vensim since the introduction of SyntheSim a few years ago, though with less Tufte/iPad sexiness. But other features, like Causal Tracing, are not so easily discovered – they’re effective for pros, but not new users. The way controls appear at one’s fingertips in the iPad app is very elegant. The “sweep” mode is also clever, so I implemented a similar approach (randomized initial conditions across an array dimension) in my version of the model. My favorite trick, though, is the 2D control of initial conditions via the phase diagram, which makes discovery of the system’s equilibrium easy.
The slickness of the video has led some to wonder whether existing SD tools are dinosaurs. From a design standpoint, I’d agree in some respects, but I think SD has also developed many practices – only partially embodied in tools – that address learning gaps that aren’t directly tackled by the app in the video: Continue reading “Elk, wolves and dynamic system visualization”


