The Ryan health care proposal

The Ryan budget proposal achieves the bulk of its savings by cutting health care outlays, particularly Medicare and Medicaid. The mechanism sounds a lot like a firm’s transition from a defined benefits pension plan to a defined contribution scheme. Medicaid becomes a system of block grants to states, and Medicare becomes a system of flat-rate vouchers. Along the way, it has some useful aspirations: to separate health insurance from employment and eliminate health’s favored tax status.

Reading some of the finer print, though, I don’t think it really fixes the fundamental flaws of the current system. It’s billed as “universal access” but that’s a misnomer. It guarantees universal access to a tax credit or voucher that can be used to purchase coverage, but not universal access to coverage. That’s because it doesn’t solve the adverse selection problem. As a result, any provider that doesn’t play the usual game of excluding anyone who’s really sick from coverage (using preexisting conditions and rotating plan changes) will suffer a variant of the utility death spiral: increasing costs drive the healthy out of the plan, leaving it to serve a diminishing set of members who had the misfortune to get sick, at an escalating cost.

Universal access to coverage is left to the states, who can create assigned risk pools or other methods to cover the uncoverable. Leaving things to the states strikes me as a reasonable strategy, because the health system is so complex that evolutionary learning is likely to beat the kind of deliberate design we’ll get out of congress. But it’s not clear to me that the proposal creates any real authority to raise money to support these assigned risk pools; without money, the state mechanisms will be rather perfunctory.

The real challenge seems to me to be to address three features of health:

  • Prevention beats cure by a long shot, in terms of both cost and quality of life. In the current system, patient churn through providers eliminates most of the provider-side incentive to address this. Patients have contributed by abdicating responsibility for their own health, and insurance exacerbates the problem by obscuring the costs of the quadruple bypass that follows from a life of Big Macs.
  • Health care expenditures are extremely skewed over one’s lifetime and within age cohorts. Good behavior can’t mitigate all risk, particularly the risk of getting old. (See below for a peek at the data.)
  • In some circumstances, the health care system is capable of expending an extremely large amount of resources on a person – sometimes for a miraculous outcome, and sometimes for rather marginal end-of-life extension.

What’s needed is a distributed way to share risk (which is why it’s called insurance), while preserving incentives for good behavior and matching total expenditures to resources. That’s a tall order. It’s not clear to me that the Ryan proposal tackles it in any serious way; it just extends the flaws of the current system to Medicare patients.
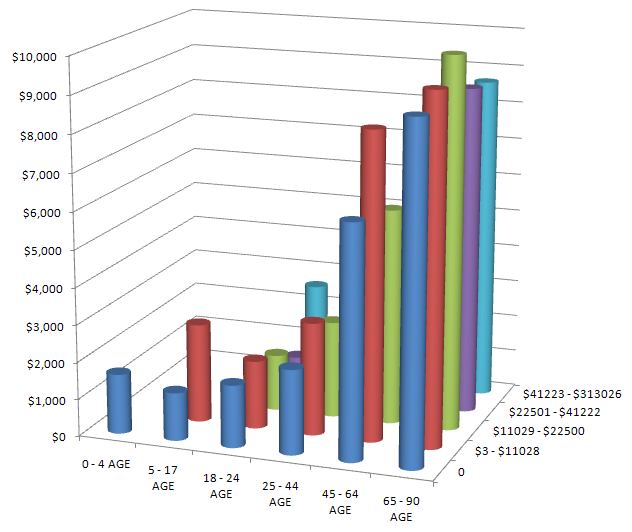
healthExpendAgeIncomeMEPSPer capita annual medical expenditures from the MEPS panel, by age and income. There’s surprisingly little variation by income, but a lot by age. The bill terminates the agency that collects this data.
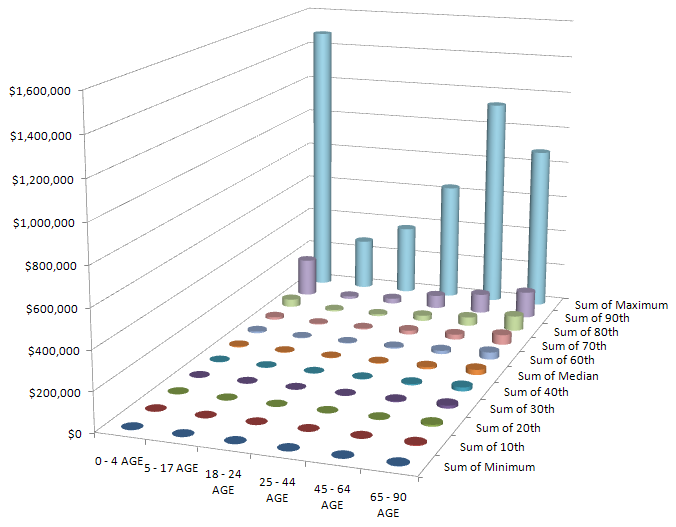
healthExpendAgeDecileMEPSHealth expenditures by age and decile of cohort, showing the extreme concentration of expenditures at all ages.

The really fine print, the text of the bill itself, is daunting – 629 pages. This strikes me as simply unmanageable (like the deceased cap and trade legislation). There are simply too many opportunities for unintended consequences, and hidden agendas, in such a multifaceted approach, especially with the opaque analytic support available. Surely this could be tackled in a series of smaller bites – health, revenue, other expenditures. It calls to mind the criticism of the FAA’s repeated failure to redesign the air traffic control system, “you can’t design a system that evolved.” Well, maybe you can, but not with the kind of tools and discourse that now prevail.
A walk through the Ryan budget proposal

Since the budget deal was announced, I’ve been wondering what was in it. It’s hard to imagine that it really works like this:

“This is an agreement to invest in our country’s future while making the largest annual spending cut in our history,” Obama said.

However, it seems that there isn’t really much substance to the deal yet, so I thought I’d better look instead at one target: the Ryan budget roadmap. The CBO recently analyzed it, and put the $ conveniently in a spreadsheet.

Like most spreadsheets, this is very good at presenting the numbers, and lousy at revealing causality. The projections are basically open-loop, but they run to 2084. There’s actually some justification for open-loop budget projections, because many policies are open loop. The big health and social security programs, for example, are driven by demographics, cutoff ages and inflation adjustment formulae. The demographics and cutoff ages are predictable. It’s harder to fathom the possible divergence between inflation adjustments and broad inflation (which affects the health sector share) and future GDP growth. So, over long horizons, it’s a bit bonkers to look at the system without considering feedback, or at least uncertainty in the future trajectory of some key drivers.

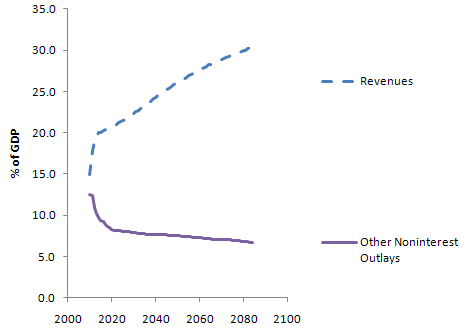
There’s also a confounding annoyance in the presentation, with budgets and debt as percentages of GDP. Here’s revenue and “other” expenditures (everything but social security, health and interest):

RevenueOtherTransientThere’s a huge transient in each, due to the current financial mess. (Actually this behavior is to some extent deliberately Keynesian – the loss of revenue in a recession is amplified over the contraction of GDP, because people fall into lower tax brackets and profits are more volatile than gross activity. Increased borrowing automatically takes up the slack, maintaining more stable spending.) The transient makes it tough to sort out what’s real change, and what is merely the shifting sands of the GDP denominator. This graph also points out another irritation: there’s no history. Is this plausible, or unprecedented behavior?
The Ryan team actually points out some of the same problems with budgets and their analyses:

One reason the Federal Government’s major entitlement programs are difficult to control is that they are designed that way. A second is that current congressional budgeting provides no means of identifying the long-term effects of near-term program expansions. A third is that these programs are not subject to regular review, as annually appropriated discretionary programs are; and as a result, Congress rarely evaluates the costs and effectiveness of entitlements except when it is proposing to enlarge them. Nothing can substitute for sound and prudent policy choices. But an improved budget process, with enforceable limits on total spending, would surely be a step forward. This proposal calls for such a reform.

Unfortunately the proposed reforms don’t seem to change anything about the process for analyzing the budget or designing programs. We need transparent models with at least a little bit of feedback in them, and programs that are robust because they’re designed with that little bit of feedback in mind.

Setting aside these gripes, here’s what I can glean from the spreadsheet.

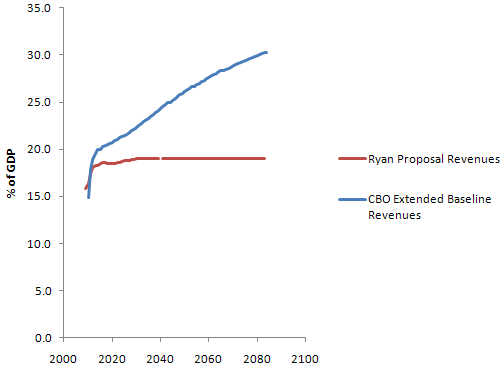
The Ryan proposal basically flatlines revenue at 19% of GDP, then squashes programs to fit. By contrast, the CBO Extended Baseline scenario expands programs per current rules and then raises revenue to match (very roughly – the Ryan proposal actually winds up with slightly more public debt 20 years from now).

RevenueIt’s not clear how the 19% revenue level arises; the CBO used a trajectory from Ryan’s staff, not its own analysis. Ryan’s proposal says:
  • Provides individual income tax payers a choice of how to pay their taxes – through existing law, or through a highly simplified code that fits on a postcard with just two rates and virtually no special tax deductions, credits, or exclusions (except the health care tax credit).
  • Simplifies tax rates to 10 percent on income up to $100,000 for joint filers, and $50,000 for single filers; and 25 percent on taxable income above these amounts. Also includes a generous standard deduction and personal exemption (totaling $39,000 for a family of four).
  • Eliminates the alternative minimum tax [AMT].
  • Promotes saving by eliminating taxes on interest, capital gains, and dividends; also eliminates the death tax.
  • Replaces the corporate income tax – currently the second highest in the industrialized world – with a border-adjustable business consumption tax of 8.5 percent. This new rate is roughly half that of the rest of the industrialized world.

It’s not clear that there’s any analysis to back up the effects of this proposal. Certainly it’s an extremely regressive shift. Real estate fans will flip when they find out that the mortgage interest deduction is gone (actually a good idea, I think).

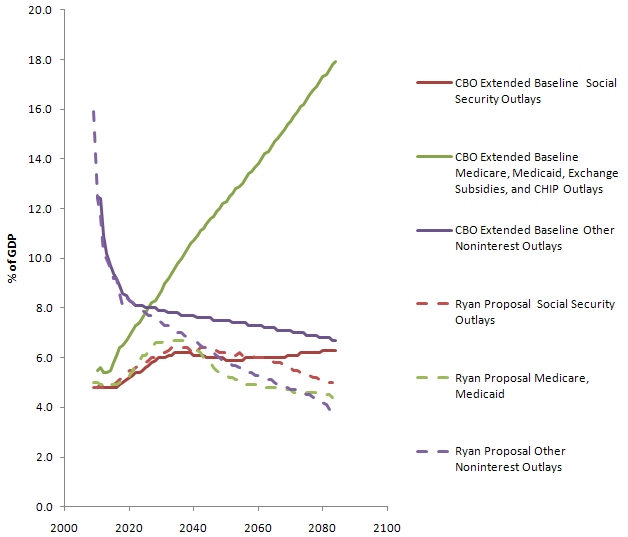
On the outlay side, here’s the picture (CBO in solid lines; Ryan proposal with dashes):

OutlaysYou can see several things here:

  • Social security is untouched until some time after 2050. CBO says that the proposal doesn’t change the program; Ryan’s web site partially privatizes it after about a decade and “eventually” raises the retirement age. There seems to be some disconnect here.
  • Health care outlays are drastically lower; this is clearly where the bulk of the savings originate. Even so, there’s not much change in the trend until at least 2025 (the initial absolute difference is definitional – inclusion of programs other than Medicare/Medicaid in the CBO version).
  • Other noninterest outlays also fall substantially – presumably this means that all other expenditures would have to fit into a box not much bigger than today’s defense budget, which seems like a heroic assumption even if you get rid of unemployment, SSI, food stamps, Section 8, and all similar support programs.

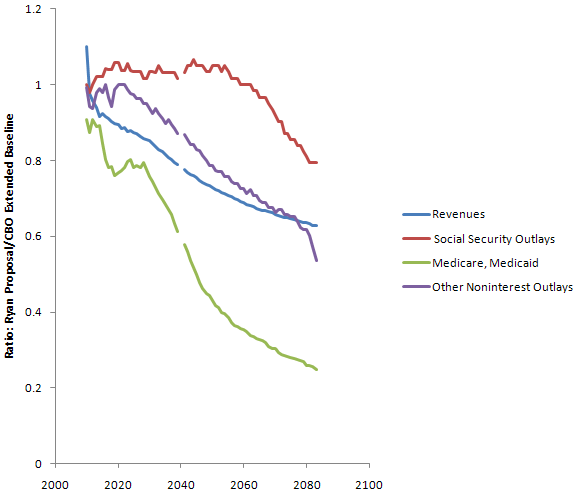
You can also look at the ratio of outlays under Ryan vs. CBO’s Extended Baseline:

OutlayRatios

Since health care carries the flag for savings, the question is, will the proposal work? I’ll take a look at that next.

Then & Now

Time has an interesting article on the climate policy positions of the GOP front runners. It’s amazing how far we’ve backed away from regulating greenhouse emissions:

Then Now
Pawlenty signed the Next Generation Energy Act of 2007 in Minnesota, which called for a plan to “recommend how the state could adopt a regulatory system that imposes a cap on the aggregate air pollutant emissions of a group of sources.” The current Tim Pawlenty line on carbon is that “cap and trade would be a disaster.”
Here he is in Iowa in 2007, voicing concern about man-made global warming while supporting more government subsidies for new energy sources, new efficiency standards, and a new global carbon treaty. Mitt Romney regularly attacks Barack Obama for pushing a cap and trade system through Congress.

And so on…

I can’t say that I’ve ever been much of a cap and trade fan, and I’d lay a little of the blame for our current sorry state at the door of cap and trade supporters who were willing to ignore what a bloated beast the bills had become. Not much, though. Most of the blame falls to the anti-science and let’s pretend externalities don’t exist crowds, who wouldn’t give a carbon tax the time of day either.

How to be confused about nuclear safety

There’s been a long running debate about nuclear safety, which boils down to, what’s the probability of significant radiation exposure? That in turn has much to do with the probability of core meltdowns and other consequential events that could release radioactive material.

I asked my kids about an analogy to the problem: determining whether a die was fair. They concluded that it ought to be possible to simply roll the die enough times to observe whether the outcome was fair. Then I asked them how that would work for rare events – a thousand-sided die, for example. No one wanted to roll the dice that much, but they quickly hit on the alternative: use a computer. But then, they wondered, how do you know if the computer model is any good?

Those are basically the choices for nuclear safety estimation: observe real plants (slow, expensive), or use models of plants.

If you go the model route, you introduce an additional layer of uncertainty, because you have to validate the model, which in itself is difficult. It’s easy to misjudge reactor safety by doing five things:

  • Ignore the dynamics of the problem. For example, use a statistical model that doesn’t capture feedback. Presumably there have been a number of reinforcing feedbacks operating at the Fukushima site, causing spillovers from one system to another, or one plant to another:
    • Collateral damage (catastrophic failure of part A damages part B)
    • Contamination (radiation spewed from one reactor makes it unsafe to work on others)
    • Exhaustion of common resources (operators, boron)
  • Ignore the covariance matrix. This can arise in part from ignoring the dynamics above. But there are other possibilities as well: common design elements, or colocation of reactors, that render failure events non-independent.
  • Model an idealized design, not a real plant: ignore components that don’t perform to spec, nonlinearities in responses to extreme conditions, and operator error.
  • Draw a narrow boundary around the problem. Over the last week, many commentators have noted that reactor containment structures are very robust, and explicitly designed to prevent a major radiation release from a worst-case core meltdown. However, that ignores spent fuel stored outside of containment, which is apparently a big part of the Fukushima hazard now.
  • Ignore the passage of time. This can both help and hurt: newer reactor designs should benefit from learning about problems with older ones; newer designs might introduce new problems; life extension of old reactors introduces its own set of engineering issues (like neutron embrittlement of materials).
  • Ignore the unknown unknowns (easy to say, hard to avoid).

I haven’t read much of the safety literature, so I can’t say to what extent the above issues apply to existing risk analyses based on statistical models or detailed plant simulation codes. However, I do see a bit of a disconnect between actual performance and risk numbers that are often bandied about from such studies: the canonical risk of 1 meltdown per 10,000 reactor years, and other even smaller probabilities on the order of 1 per 100,000 or 1,000,000 reactor years.

I built myself a little model to assess the data, using WNA data to estimate reactor-years of operation and a wiki list of accidents. One could argue at length which accidents should be included. Only light water reactors? Only modern designs? I tend to favor a liberal policy for including accidents. As soon as you start coming up with excuses to exclude things, you’re headed toward an idealized world view, where operators are always faithful, plants are always shiny and new, or at least retired on schedule, etc. Still, I was a bit conservative: I counted 7 partial or total meltdown accidents in commercial or at least quasi-commercial reactors, including Santa Susana, Fermi, TMI, Chernobyl, and Fukushima (I think I missed Chapelcross). Then I looked at maximum likelihood estimates of meltdown frequency over various intervals. Using all the data, assuming Poisson arrivals of meltdowns, you get .6 failures per thousand reactor-years (95% confidence interval .3 to 1). That’s up from .4 [.1,.8] before Fukushima. Even if you exclude the early incidents and Fukushima, you’re looking at .2 [.04,.6] meltdowns per thousand reactor years – twice the 1-per-10,000 target. For the different subsets of the data, the estimates translate to an expected meltdown frequency of about once to thrice per decade, assuming continuing operations of about 450 reactors. That seems pretty bad.

In other words, the actual experience of rolling the dice seems to be yielding a riskier outcome than risk models suggest. One could argue that most of the failing reactors were old, built long ago, or poorly designed. Maybe so, but will we ever have a fleet of young rectors, designed and operated by demigods? That’s not likely, but surely things will get somewhat better with the march of technology. So, the question is, how much better? Areva’s 10x improvement seems inadequate if it’s measured against the performance of existing plants, at least if we plan to grow the plant fleet by much more than a factor of 10 to replace fossil fuels. There are newer designs around, but they depart from the evolutionary path of light water reactors, which means that “past performance is no indication of future returns” applies – will greater passive safety outweigh the effects of jumping to a new, less mature safety learning curve?

It seems to me that we need models of plant safety that square with the actual operational history of plants, to reconcile projected risk with real-world risk experience. If engineers promote analysis that appears unjustifiably optimistic, the public will do what it always does: discount the results of formal models, in favor of mental models that may be informed by superstition and visions of mushroom clouds.

The House Climate Science Hearing

Science’s Eli Kintishch and Gavin Schmidt liveblogged the House hearing on climate science this morning. My favorite tidbits:

Gavin Schmidt:

One theme that will be constant is that unilateral action by the US is meaningless if everyone else continues with business as usual. However, this is not a ethical argument for not doing anything. Edward Burke (an original conservative) rightly said: “Nobody made a greater mistake than he who did nothing because he could do only a little.” http://www.realclimate.org/index.php/archives/2009/05/the-tragedy-of-climate-commons/

Eli Kintisch:

If my doctor told me I had cancer, says Waxman, “I wouldn’t scour the country to find someone who said I didn’t need [treatment]”

[Comment From Roger Pielke, Jr. Roger Pielke, Jr. : ]

Because Congress has granted EPA authority to regulate, and the agency has followed its legislative mandate. If Congress wants to change how EPA operates, fine, but it must do it comprehensively, not by seeking to overturn the endangerment finding via fiat.

[Comment From Steven Leibo Ph.D. Steven Leibo Ph.D. : ]

If republicans thought this hearing would be helpful for their cause it was surely a big mistake..that from a non scientist

[Comment From J Bowers J Bowers : ]

There are no car parks or air conditioners in space.

Eli Kintisch:

Burress: US had popular “revulsion” against the Waxman Markey bill. “Voting no was not enough…people wanted us to stop that thing dead in its tracks” No action by India and China…

[Comment From thingsbreak thingsbreak : ]

This India and China bashing is perverse, from an emissions “pie slicing” perspective.

Eli Kintisch:

Inslee: “embarassment” that “chronic anti-science” syndrome by Republicans. Colleagues in GOP won’t believe, he says, “until the entire antarctic ice sheet has melted or hell has frozen over”

Eli Kintisch:

Rep Griffith (R-Va): Asks about melting ice caps on Mars. Is sun getting brighter, he asks?

[Comment From thingsbreak thingsbreak : ]

Mars ice caps melting. Drink!

[Comment From Roger Pielke, Jr. Roger Pielke, Jr. : ]

Mars ice caps, snore!

Eli Kintisch:

In general I would say this hearing is a disappointment: the issue of whether congress can/should have a close control on EPA decisions is at least an interesting one that different people who are reasonable can disagree about.

So far little discussion of that issue at all. 🙁

Maybe because these are scientists the real issue is just not coming up. Weird hearing.

Eli Kintisch:

Waxman: I would hate to see Congress take a position “that the science was false” by passing/marking up HR 910; wants to slow mark up on tuesday. But Whitfield disagrees; says that markup on thursday will proceed and debate will go on then…

Eli Kintisch:

Rush (who is the ranking member on this subcommittee) also asks Whitfield to delay the thursday markup. “Force.. the American people…we should be more deliberative”

Gavin Schmidt:

So that’s that. I can’t say I was particularly surprised at how it went. Far too much cherry-picking, strawmen arguments and posturing. Is it possible to have susbtantive discussion in public on these issues?

I think I shouldn’t have peeked into the sausage machine.

The rebound delusion

Lately it’s become fashionable to claim that energy efficiency is useless, because the rebound effect will always eat it up. This is actually hogwash, especially in the short term. James Barrett has a nice critique of the super-rebound position at RCE. Some excerpts:

To be clear, the rebound effect is real. The theory behind it is sound: Lower the cost of anything and people will use more of it, including the cost of running energy consuming equipment. But as with many economic ideas that are sound theory (like the idea that you can raise government revenues by cutting tax rates), the trick is in knowing how far to take them in reality. (Cutting tax rates from 100% to 50% would certainly raise revenues. Cutting them from 50% to 0% would just as surely lower them.)

The problem with knowing how far to take things like this is that unlike real scientists who can run experiments in a controlled laboratory environment, economists usually have to rely on what we can observe in the real world. Unfortunately, the real world is complicated and trying to disentangle everything that’s going on is very difficult.

Owen cleverly avoids this problem by not trying to disentangle anything.

One supposed example of the Jevons paradox that he points to in the article is air conditioning. Citing a conversation with Stan Cox, author of Losing Our Cool, Owen notes that between 1993 and 2005, air conditioners in the U.S. increased in efficiency by 28%, but by 2005, homes with air conditioning increased their consumption of energy for their air conditioners by 37%.

Accounting only for the increased income over the timeframe and fixing Owen’s mistake of assuming that every air conditioner in service is new, a few rough calculations point to an increase in energy use for air conditioning of about 30% from 1993 to 2005, despite the gains in efficiency. Taking into account the larger size of new homes and the shift from room to central air units could easily account for the rest.

All of the increase in energy consumption for air conditioning is easily explained by factors completely unrelated to increases in energy efficiency. All of these things would have happened anyway. Without the increases in efficiency, energy consumption would have been much higher.

It’s easy to be sucked in by stories like the ones Owen tells. The rebound effect is real and it makes sense. Owen’s anecdotes reinforce that common sense. But it’s not enough to observe that energy use has gone up despite efficiency gains and conclude that the rebound effect makes efficiency efforts a waste of time, as Owen implies. As our per capita income increases, we’ll end up buying more of lots of things, maybe even energy. The question is how much higher would it have been otherwise.

Why is the rebound effect suddenly popular? Because an overwhelming rebound effect is needed to make sense of proposals to give up on near-term emissions prices and invest in technology, praying for a clean-energy-supply miracle in a few decades.

As Barrett points out, the notion that energy efficiency increases energy use is an exaggeration of the rebound effect. For efficiency to increase use, energy consumption has to be elastic (e<-1). I don’t remember ever seeing an economic study that came to that conclusion. In a production function, such values aren’t physically plausible, because they imply zero energy consumption at a finite energy price.

Therefore, the notion that pursuing energy efficiency makes the climate situation worse is a fabrication. Doubly so, because of an accounting sleight-of-hand. Consider two extremes:

  1. no rebound effects (elasticity ~ 0): efficiency policies work, because they reduce energy use and its associated negative social externalities.
  2. big rebound effects (elasticity < -1): efficiency policies increase energy use, but they do so because there’s a huge private benefit from the increase in mobility or illumination or whatever private purpose the energy is put to.

The super-rebound crowd pooh-poohs #1 and conveniently ignores the welfare outcome of #2, accounting only for the negative side effects.

If rebound effects are modest, as they surely are, it makes much more sense to guide R&D and deployment for both energy supply and demand with a current price signal on emissions. That way, firms make distributed decisions about where to invest, rather than the government picking winners, and appropriate tradeoffs between conservation and clean supply are possible. The price signal can be adapted to meet environmental constraints in the face of rising income. Progress starts now, rather than after decades of waiting for the discover->apply->deploy->embody pipeline.

If the public isn’t ready for it, that doesn’t mean analysts should bargain against their own good sense by recommending things that might be popular, but are unlikely to work. That’s like a doctor advising a smoker to give to cancer research, without mentioning that he really ought to quit.

Update: there’s an excellent followup at RCE.

Storytelling and playing with systems

This journalist gets it:

Maybe journalists shouldn’t tell stories so much. Stories can be a great way of transmitting understanding about things that have happened. The trouble is that they are actually a very bad way of transmitting understanding about how things work. Many of the most important things people need to know about aren’t stories at all.

Our work as journalists involves crafting rewarding media experiences that people want to engage with. That’s what we do. For a story, that means settings, characters, a beginning, a muddle and an end. That’s what makes a good story.

But many things, like global climate change, aren’t stories. They’re issues that can manifest as stories in specific cases.

… the way that stories transmit understanding is only one way of doing so. When it comes to something else – a really big, national or world-spanning issue, often it’s not what happened that matters, so much as how things work.

…When it comes to understanding a system, though, the best way is to interact with it.

Play is a powerful way of learning. Of course the systems I’ve listed above are so big that people can’t play with them in reality. But as journalists we can create models that are accurate and instructive as ways of interactively transmitting understanding.

I use the word ‘play’ in its loosest sense here; one can ‘play’ with a model of a system the same way a mechanic ‘plays’ around with an engine when she’s not quite sure what might be wrong with it.

The act of interacting with a system – poking and prodding, and finding out how the system reacts to your changes – exposes system dynamics in a way nothing else can.

If this grabs you at all, take a look at the original – it includes some nice graphics and an interesting application to class in the UK. The endpoint of the forthcoming class experiment is something like a data visualization tool. It would be cool if they didn’t stop there, but actually created a way for people to explore the implications of different models accounting for the dynamics of class, as Climate Colab and Climate Interactive do with climate models.

Now cap & trade is REALLY dead

From the WaPo:

[Obama] also virtually abandoned his legislation – hopelessly stalled in the Senate – featuring economic incentives to reduce carbon emissions from power plants, vehicles and other sources.

“I’m going to be looking for other means of addressing this problem,” he said. “Cap and trade was just one way of skinning the cat,” he said, strongly implying there will be others.

In the campaign, Republicans slammed the bill as a “national energy tax” and jobs killer, and numerous Democrats sought to emphasize their opposition to the measure during their own re-election races.

Brookings reflects, Toles nails it.

Modelers: you're not competing

Well, maybe a little, but it doesn’t help.

From time to time we at Ventana encounter consulting engagements where the problem space is already occupied by other models. Typically, these are big, detailed models from academic or national lab teams who’ve been working on them for a long time. For example, in an aerospace project we ran into detailed point-to-point trip generation models and airspace management simulations with every known airport and aircraft in them. They were good, but cumbersome and expensive to run. Our job was to take a top-down look at the big picture, integrating the knowledge from the big but narrow models. At first there was a lot of resistance to our intrusion, because we consumed some of the budget, until it became evident that the existence of the top-down model added value to the bottom-up models by placing them in context, making their results more relevant. The benefit was mutual, because the bottom-up models provided grounding for our model that otherwise would have been very difficult to establish. I can’t quite say that we became one big happy family, but we certainly developed a productive working relationship.

I think situations involving complementary models are more common than head-to-head competition among models that serve the same purpose. Even where head-to-head competition does exist, it’s healthy to have multiple models, especially if they embody different methods. (The trouble with global climate policy is that we have many models that mostly embody the same general equilibrium assumptions, and thus differ only in detail.) Rather than getting into methodological pissing matches, modelers should be seeking the synergy among their efforts and making it known to decision makers. That helps to grow the pie for all modeling efforts, and produces better decisions.

Certainly there are exceptions. I once ran across a competing vendor doing marketing science for a big consumer products company. We were baffled by the high R^2 values they were reporting (.92 to .98), so we reverse engineered their model from the data and some slides (easy, because it was a linear regression). It turned out that the great fits were due to the use of 52 independent parameters to capture seasonal variation on a weekly basis. Since there were only 3 years of data (i.e. 3 points per parameter), we dubbed that the “variance eraser.” Replacing the 52 parameters with a few targeted at holidays and broad variations resulted in more realistic fits, and also revealed problems with inverted signs (presumably due to collinearity) and other typical pathologies. That model deserved to be displaced. Still, we learned something from it: when we looked cross-sectionally at several variants for different products, we discovered that coefficients describing the sales response to advertising were dependent on the scale of the product line, consistent with our prior assertion that effects of marketing and other activities were multiplicative, not additive.

The reality is that the need for models is almost unlimited.  The physical sciences are fairly well formalized, but models span a discouragingly small fraction of the scope of human behavior and institutions. We need to get the cost of providing insight down, not restrict the supply through infighting. The real enemy is seldom other models, but rather superstition, guesswork and propaganda.