Disinfographics

I cringed when I saw the awful infographics in a recent GreenBiz report, highlighted in a Climate Progress post. A site that (rightly) criticizes the scientific illiteracy of the GOP field shouldn’t be gushing over chartjunk that would make USA Today blush. Climate Progress dumped my mildly critical comment into eternal moderation queue purgatory, so I have to rant about this a bit.

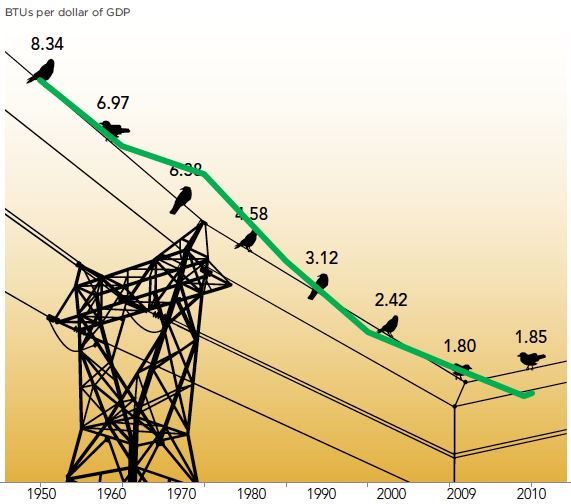
Here’s one of the graphics, with my overlay of the data plotted correctly (in green):

“What We Found: The energy consumed per dollar of gross domestic product grew slightly in 2010, the first increase after steady declines for more than half a century.”

Notice that:

  • No, there really wasn’t a great cosmic coincidence that caused energy intensity to progress at a uniform rate from 1950-1970 and 1980-2009, despite the impression given by the arrangements of points on the wire.
  • The baseline of the original was apparently some arbitrary nonzero value.
  • The original graphic vastly overstates the importance of the last two data points by using a nonuniform time axis.

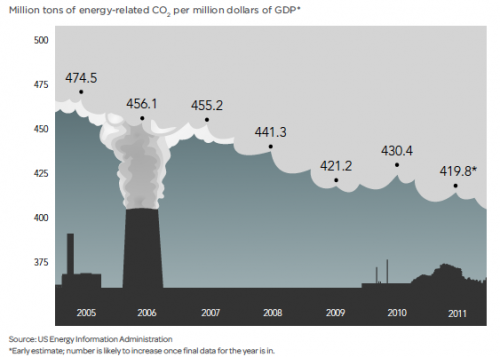
The issues are not merely aesthetic; the bad graphics contribute to distorted interpretations of reality, as the caption above indicates. From another graphic (note the short horizon and nonzero baseline), CP extracts the headline, “US carbon intensity is flat lining.”

From any reasonably long sample of the data it should be clear that the 2009-2011 “flat lining” is just a blip, having little to do with the long term emission trends we need to modify to achieve deep emissions reductions.

The other graphics in the article are each equally horrific in their own special way.

My advice to analysts is simple. If you want to communicate information, find someone numerate who’s read Tufte to make your plots. If you must have a pretty picture for eye candy, use it as a light background to an accurate plot. If you want pretty pictures to persuade people without informing them, skip the data and use a picture of a puppy. Here, you can even use my puppy:

Why learn calculus?

A young friend asked, why bother learning calculus, other than to get into college?

The answer is that calculus holds the keys to the secrets of the universe. If you don’t at least have an intuition for calculus, you’ll have a harder time building things that work (be they machines or organizations), and you’ll be prey to all kinds of crank theories. Of course, there are lots of other ways to go wrong in life too. Be grumpy. Don’t brush your teeth. Hang out in casinos. Wear white shoes after Labor Day. So, all is not lost if you don’t learn calculus. However, the world is less mystifying if you do.

The amazing thing is, calculus works. A couple of years ago, I found my kids busily engaged in a challenge, using a sheet of tinfoil of some fixed size to make a boat that would float as many marbles as possible. They’d managed to get 20 or 30 afloat so far. I surreptitiously went off and wrote down the equation for the volume of a rectangular prism, subject to the constraint that its area not exceed the size of the foil, and used calculus to maximize. They were flabbergasted when I managed to float over a hundred marbles on my first try.

The secrets of the universe come in two flavors. Mathematically, those are integration and differentiation, which are inverses of one another.

Continue reading “Why learn calculus?”

Sandpiles & Systems

Sand piles are sometimes used as a counterpoint to systems, where a system is a bunch of interconnected components that interact in some interesting way, while a sand pile is just a bunch of boring stuff. Ironically, sand piles are actually pretty interesting – they self organize. Avalanches regulate the angle of repose of the pile. In aggregate, one can think of this as a negative feedback process – when the pile is too steep, it avalanches, building up the base and lowering the top. There’s more to the picture when you look at it from a disaggregate perspective; the resulting state is an example of self-organized criticality, and if you keep adding to the pile, you get avalanches at all scales (i.e. a power law distribution).

Overnight, nature left me a nice example of a snow pile system on our front stair railing. At some point, the accumulated snow on the handrail partially avalanched, leaving bare wood on its lower half. Evidently the railing is at just the right angle for the ongoing snowfall, fine grains due to the cold, to make a kind of cellular automaton, resulting in this surprisingly regular pattern, reminiscent of a Sierpinski triangle or one of Wolfram’s elementary systems.

Is social networking making us dumber?

Another great conversation at the Edge weaves together a number of themes I’ve been thinking about lately, like scientific revolutions, big data, learning from models, filter bubbles and the balance between content creation and consumption. I can’t embed, or do it full justice, so go watch the video or read the transcript (the latter is a nice rarity these days).

Pagel’s fundamental hypothesis is humans as social animals are wired for imitation more than innovation, for the very good reason that imitation is easy, while innovation is hard, error-prone and sometimes dangerous. Better communication intensifies the advantage to imitators, as it has become incredibly cheap to observe our fellows in large networks like Facebook. There are a variety of implications of this, including the possibility that, more than ever, large companies have strong incentives to imitate through acquisition of small innovators rather than to risk innovating themselves. This resonates very much with Ventana colleague David Peterson’s work on evolutionary simulation of the origins of economic growth and creativity.

Continue reading “Is social networking making us dumber?”

Self-generated Seasonal Cycles

Why is Black Friday the biggest shopping day of the year? Back in 1961, Jay Forrester identified an endogenous cause in Appendix N of Industrial Dynamics, Self-generated Seasonal Cycles:

Industrial policies adopted in recognition of seasonal sales patterns may often accentuate the very seasonality from which they arise. A seasonal forecast can lead to action that may cause fulfillment of the forecast. In closed-loop systems this is a likely possibility. … any effort toward statistical isolation of a seasonal sales component will find some seasonality in the random disturbances. Should the seasonality so located lead to decisions that create actual seasonality, the process can become self-regenerative.

I think there are actually quite a few reinforcing feedback mechanisms, some of which cross consumer-business stovepipes and therefore are difficult to address.

Before heading to the mall, it’s a good day to think about stuff.

Update: another interesting take.

Et tu, Groupon?

Is Groupon overvalued too? Modeling Groupon actually proved a bit more challenging than my last post on Facebook.

Again, I followed in the footsteps of Cauwels & Sornette, starting with the SEC filing data they used, with an update via google. C&S fit a logistic to Groupon’s cumulative repeat sales. That’s actually the end of a cascade of participation metrics, all of which show logistic growth:

The variable of greatest interest with respect to revenue is Groupons sold. But the others also play a role in determining costs – it takes money to acquire and retain customers. Also, there are actually two populations growing logistically – users and merchants. Growth is presumably a function of the interaction between these two populations. The attractiveness of Groupon to customers depends on having good deals on offer, and the attractiveness to merchants depends on having a large customer pool.

I decided to start with the customer side. The customer supply chain looks something like this:

Subscribers data includes all three stocks, cumulative customers is the right two, and cumulative repeat customers is just the rightmost.

Continue reading “Et tu, Groupon?”

Time to short some social network stocks?

I don’t want to wallow too long in metaphors, so here’s something with a few equations.

A recent arXiv paper by Peter Cauwels and Didier Sornette examines market projections for Facebook and Groupon, and concludes that they’re wildly overvalued.

We present a novel methodology to determine the fundamental value of firms in the social-networking sector based on two ingredients: (i) revenues and profits are inherently linked to its user basis through a direct channel that has no equivalent in other sectors; (ii) the growth of the number of users can be calibrated with standard logistic growth models and allows for reliable extrapolations of the size of the business at long time horizons. We illustrate the methodology with a detailed analysis of facebook, one of the biggest of the social-media giants. There is a clear signature of a change of regime that occurred in 2010 on the growth of the number of users, from a pure exponential behavior (a paradigm for unlimited growth) to a logistic function with asymptotic plateau (a paradigm for growth in competition). […] According to our methodology, this would imply that facebook would need to increase its profit per user before the IPO by a factor of 3 to 6 in the base case scenario, 2.5 to 5 in the high growth scenario and 1.5 to 3 in the extreme growth scenario in order to meet the current, widespread, high expectations. […]

I’d argue that the basic approach, fitting a logistic to the customer base growth trajectory and multiplying by expected revenue per customer, is actually pretty ancient by modeling standards. (Most system dynamicists will be familiar with corporate growth models based on the mathematically-equivalent Bass diffusion model, for example.) So the surprise for me here is not the method, but that forecasters aren’t using it.

Looking around at some forecasts, it’s hard to say what forecasters are actually doing. There’s lots of handwaving and blather about multipliers, and little revelation of actual assumptions (unlike the paper). It appears to me that a lot of forecasters are counting on big growth in revenue per user, and not really thinking deeply about the user population at all.

To satisfy my curiosity, I grabbed the data out of Cauwels & Sornette, updated it with the latest user count and revenue projection, and repeated the logistic model analysis. A few observations:

I used a generalized logistic, which has one more parameter, capturing possible nonlinearity in the decline of the growth rate of users with increasing saturation of the market. Here’s the core model:

Continue reading “Time to short some social network stocks?”

Social network valuation with logistic models

This is a logistic growth model for Facebook’s user base, with a very simple financial projection attached. It’s inspired by:

Quis pendit ipsa pretia: facebook valuation and diagnostic of a bubble based on nonlinear demographic dynamics

Peter Cauwels, Didier Sornette

We present a novel methodology to determine the fundamental value of firms in the social-networking sector based on two ingredients: (i) revenues and profits are inherently linked to its user basis through a direct channel that has no equivalent in other sectors; (ii) the growth of the number of users can be calibrated with standard logistic growth models and allows for reliable extrapolations of the size of the business at long time horizons. We illustrate the methodology with a detailed analysis of facebook, one of the biggest of the social-media giants. There is a clear signature of a change of regime that occurred in 2010 on the growth of the number of users, from a pure exponential behavior (a paradigm for unlimited growth) to a logistic function with asymptotic plateau (a paradigm for growth in competition). We consider three different scenarios, a base case, a high growth and an extreme growth scenario. Using a discount factor of 5%, a profit margin of 29% and 3.5 USD of revenues per user per year yields a value of facebook of 15.3 billion USD in the base case scenario, 20.2 billion USD in the high growth scenario and 32.9 billion USD in the extreme growth scenario. According to our methodology, this would imply that facebook would need to increase its profit per user before the IPO by a factor of 3 to 6 in the base case scenario, 2.5 to 5 in the high growth scenario and 1.5 to 3 in the extreme growth scenario in order to meet the current, widespread, high expectations. …

(via the arXiv blog)

This is not an exact replication of the model (though you can plug in the parameters from C&S’ paper to replicate their results). I used slightly different estimation methods, a generalization of the logistic (for saturation exponent <> 1), and variable revenues and interest rates in the projections (also optional).

This is a good illustration of how calibration payoffs work. The payoff in this model is actually a policy payoff, because the weighted sum-squared-error is calculated explicitly in the model. That makes it possible to generate Monte Carlo samples and filter them by SSE, and also makes it easier to estimate the scale and variation in the standard error of user base reports.

The model is connected to input data in a spreadsheet. Most is drawn from the paper, but I updated users and revenues with the latest estimates I could find.

A command script replicates optimization runs that fit the model to data for various values of the user carrying capacity K.

Note that there are two views, one for users, and one for financial projections.

See my accompanying blog post for some reflections on the outcome.

This model requires Vensim DSS, Pro, or the Model Reader. facebook 3.vpm or facebook3.zip (The .zip is probably easier if you have DSS or Pro and want to work with the supplementary control files.)

Update: I’ve added another set of models for Groupon: groupon 1.vpmgroupon 2.vpm and groupon.zip groupon3.zip

See my latest blog post for details.