Maya fall to positive feedback

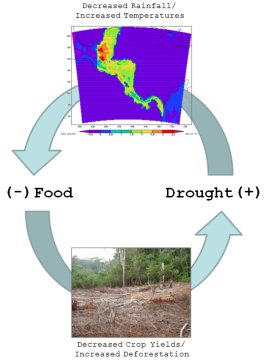
NASA has an interesting article on the fall of the Maya. NASA-sponsored authors used climate models to simulate the effects of deforestation on local conditions. The result: evidence for a positive feedback cycle of lower yields, requiring greater deforestation to increase cultivated area, causing drought and increased temperatures, further lowering yields.

Mayan vicious cycle

NASA

“They did it to themselves,” says veteran archeologist Tom Sever.

A major drought occurred about the time the Maya began to disappear. And at the time of their collapse, the Maya had cut down most of the trees across large swaths of the land to clear fields for growing corn to feed their burgeoning population. They also cut trees for firewood and for making building materials.

“They had to burn 20 trees to heat the limestone for making just 1 square meter of the lime plaster they used to build their tremendous temples, reservoirs, and monuments,” explains Sever.

“In some of the Maya city-states, mass graves have been found containing groups of skeletons with jade inlays in their teeth – something they reserved for Maya elites – perhaps in this case murdered aristocracy,” [Griffin] speculates.

No single factor brings a civilization to its knees, but the deforestation that helped bring on drought could easily have exacerbated other problems such as civil unrest, war, starvation and disease.

An SD Conference article by Tom Forest fills in some of the blanks on the other problems:

… this paper illustrates how humans can politically intensify resource shortages into universal disaster.

In the current model, the land sector has two variables. One is productivity, which is exhausted by people but regenerates over a period of time. The other… is Available Land. When population exceeds carrying capacity, warfare frequency and intensity increase enough to depopulate land. In the archaeological record this is reflected by the construction of walls around cities and the abandonment of farmlands outside the walls. Some land becomes unsafe to use because of conflict, which then reduces the carrying capacity and intensifies warfare. This is an archetypal death spiral. Land is eventually reoccupied, but more slowly than the abandonment. A population collapse eventually hastens the recovery of productivity, so after the brief but severe collapse growth resumes from a much lower level.

The key dynamic is that people do not account for the future impact of their numbers on productivity, and therefore production, when they have children. Nor does death by malnutrition and starvation have an immediate effect. This leads to an overshoot, as in the Limits to Growth, but the policy response is warfare proportionate to the shortfall, which takes more land out of production and worsens the shortfall.

Put another way, in the growth phase people are in a positive-sum game. There is more to go around, more wealth to share, and population increase is unhindered by policy or production. But once the limits are reached, people are in a zero-sum game, or even slightly negative-sum. Rather than share the pain, people turn on each other to increase their personal share of a shrinking pie at the expense of others. The unintended consequence-the fatal irony-is that by doing so, the pie shrinks much faster than it would otherwise. Apocalypse is the result.

Making climate endogenous in Forest’s model would add another positive feedback loop, deepening the trap for a civilization that crosses the line from resource abundance to scarcity and degradation.

Montana DEQ – rocks in its head?

Lost socks are a perpetual problem around here. A few years back, the kids would come to me for help, and I’d reflexively ask, “well, did you actually go into your room and look in the sock drawer?” Too often, he answer was “uh, no,” and I’d find myself explaining that it wasn’t very meaningful to not find something when you haven’t looked properly. Fortunately those days are over at our house. Unfortunately, Montana’s Department of Environmental Quality (DEQ) insists on reliving them every time someone applies for a gravel mining permit.

Montana’s constitution guarantees the right to a clean and healthful environment, with language that was the strongest of its kind in the nation at the time it was written. [*] Therefore you’d think that DEQ would be an effective watchdog, but the Opencut Mining Program’s motto seems to be “see no evil.” In a number of Environmental Assessments of gravel mining applications, DEQ cites the Rygg Study (resist the pun) to defend the notion – absurd on its face – that gravel pits have no impact on adjacent property values.  For example:

Several years ago, DEQ contracted a study to determine “whether the existence of a gravel pit and gravel operation impacts the value of surrounding real property.” The study (Rygg, February 1998) involved some residential property near two gravel operations in the Flathead Valley. Rygg concluded that the above-described mitigating measures were effective in preventing decrease in taxable value of those lands surrounding the gravel pits.

The study didn’t even evaluate mitigating measures, but that’s the least of what’s wrong (read on). Whenever Rygg comes up,the “Fairbanks review” is not far behind. It’s presented like a formal peer review, but the title actually just means, “some dude at the DOR named Fairbanks read this, liked it, and added his own unsubstantiated platitudes to the mix.” The substance of the review is one paragraph:

“In the course of responding to valuation challenges of ad valorem tax appraisals, your reviewer has encountered similar arguments from Missoula County taxpayers regarding the presumed negative influence of gravel pits, BPA power lines, neighborhood character change, and traffic and other nuisances. In virtually ALL cases, negative value impacts were not measurable. Potential purchasers accept newly created minor nuisances that long-time residents consider value diminishing.”

First, we have no citations to back up these anecdotes. They could simply mean that the Department of Revenue arbitrarily denies requests for tax relief on these bases, because it can. Second, the boiled frog syndrome variant, that new purchasers happily accept what distresses long-term residents, is utterly unfounded. The DEQ even adds its own speculation:

The proposed Keller mine and crushing facility and other operations in the area … create the possibility of reducing the attractiveness of home sites to potential homebuyers seeking a quiet, rural/residential type of living environment. These operations could also affect the marketability of existing homes, and therefore cause a reduction in the number of interested buyers and may reduce the number of offers on properties for sale. This reduction in property turnover could lead to a loss in realtors’ fees, but should not have any long-term effect on taxable value of property. …

Never mind slaves to defunct economists, DEQ hasn’t even figured out supply and demand.

When GOMAG (a local action group responding to an explosion of gravel mining applications) pointed me to these citations, I took a look at the Rygg Study. At the time, I was working on the RLI, and well versed in property valuation methods. What I found was not pretty. I’m sure the study was executed with the best of intentions, but it uses methods that are better suited to issuing a loan in a bubble runup than to measuring anything of import. In my review I found the following:

’¢ The Rygg study contains multiple technical problems that preclude its use as a valid measurement of property value effects, including:

o The method of selection of comparable properties is not documented and is subject to selection bias, exacerbated by the small sample
o The study neglects adverse economic impacts from land that remains undeveloped
o The measure of value used by the study, price per square foot, is incomplete and yields results that are contradicted by absolute prices
o Valuation adjustments are not fully documented and appear to be ad hoc
o The study does not use accepted statistical methods or make any reference to the uncertainty in conclusions
o Prices are not adjusted for broad market appreciation or inflation, though it spans considerable time
o The study does not properly account for the history of operation of the pit

’¢ The Fairbanks review fails to consider the technical content of the Rygg study in any detail, and adds general conclusions that are unsupported by the Rygg study, data, original analysis, or citation.
’¢ Citations of the Rygg study and the Fairbanks review in environmental assessments improperly exaggerate and generalize from its conclusions.

I submitted my findings to DEQ in a long memo, during the public comment period on two gravel applications. You’d think that, in a rational world, it would provoke one of two reactions: “oops, we’d better quit citing that rubbish” or, “the review is incorrect, and Rygg is actually valid, for the following technical reasons ….”  Instead, DEQ writes,

The Rygg report is not outdated. It is factual data. The Diane Hite 2006 report upon which several of the other studies were based, used 10 year old data from the mid-1990’s. Many things, often temporary, affect property sale prices.

Huh? They’ve neatly tackled a strawdog (“outdated”) while sidestepping all of the substantive issues. What exactly does “factual data” mean anyway? It seems that DEQ is even confused about the difference between data and analysis. Nevertheless, they are happy to proceed with a recitation of Rygg and Fairbanks, in support of a finding of no “irreversible or irretrievable commitments of resources related to the area’s social and economic circumstances.”

So much for the watchdog. Where DEQ ought to be defending citizens’ constitutional rights, it seems bent on sticking its head in the sand. Its attempts to refute the common sense idea, that no one wants to live next to a gravel pit, with not-even-statistical sleight of hand grow more grotesque with each EA. I find this behavior baffling. DEQ is always quick to point out that they don’t have statutory authority to consider property values when reviewing applications, so why can’t they at least conduct an honest discussion of economic impacts? Do they feel honor-bound to defend a study they’ve cited for a decade? Are they afraid the legislature will cut off their head if they stick their neck out? Are they just chicken?

Companies – also not on track yet

The Carbon Disclosure Project has a unique database of company GHG emissions, projections and plans. Many companies are doing a good job of disclosure; remarkably, the 1309 US firms reporting account for 31% of US emissions [*]. However, the overall emissions picture doesn’t look like a plan for deep cuts. CDP calls this the “Carbon Chasm.”

Based on current reduction targets, the world’s largest companies are on track to reach the scientifically-recommended level of greenhouse gas cuts by 2089 ’“ 39 years too late to avoid dangerous climate change, reveals a research report ’“ The Carbon Chasm ’“ released today by the Carbon Disclosure Project (CDP).

It shows that the Global 100 are currently on track for an annual reduction of just 1.9% per annum which is below the 3.9% needed in order to cut emissions in developed economies by 80% in 2050. According to the Intergovernmental Panel for Climate Change (IPCC), developed economies must reduce greenhouse gas emissions by 80-95% by 2050 in order to avoid dangerous climate change. [*]

Of course there are many pitfalls here: limited sampling, selection bias, greenwash, incomplete coverage of indirect emissions, … Still, I find it quite encouraging that companies plan net cuts at all, when many governments haven’t yet managed the same feat, so top-down policy isn’t in place to support their actions.

More climate models you can run

Following up on my earlier post, a few more on the menu:

SiMCaP – A simple tool for exploring emissions pathways, climate sensitivity, etc.

PRIMAP 2C Check Tool – A dirt-simple spreadsheet, exploiting the fact that cumulative emissions are a pretty good predictor of temperature outcomes along plausible emissions trajectories.

EdGCM – A full 3D model, for those who feel the need to get physical.

Last but not least, C-LEARN runs on the web. Desktop C-ROADS software is in the development pipeline.

C-ROADS Roundup

I’m too busy to write much, but here are some quick updates.

C-ROADS is in the news, via Jeff Tolleffson at Nature News.

Our State of the Global Deal conclusion,  that current proposals are not on track, now has more reinforcement:

Check out Drew Jones on TEDx.

Allocation Oddity

Mining my hard drive for stuff I did a few weeks back, when the Waxman Markey draft was just out, I ran across this graph:

Waxman-Markey electricity & petroleum prices

It shows prices for electricity and petroleum from the ADAGE model in the June EPA analysis. BAU = business-as-usual; SCN 02 = updated Waxman-Markey scenario; SCN 06 = W-M without allowance allocations for consumer rate relief and a few other provisions. Notice how the retail price signal on electricity is entirely defeated until the 2025-2030 allowance phaseout. On the other hand, petroleum prices are up in either scenario, because there is no rate relief.

Four questions:

  • Isn’t it worse to have a big discontinuity electricity prices in 2025-2030, rather than a smaller one in 2010-2015?
  • Is your average household even going to notice a 1 or 2 c/kwh change over 5 years, given the volatility of other expenses?
  • Since the NPV of the rate relief by 2025 is not much, couldn’t the phaseout happen a little faster?
  • How does it help to defeat the price signal to the residential sector, a large energy consumer with low-hanging mitigation fruit?

Things might not be as bad as all this, if the goal (not mandate) of serving up rate relief as flat or fixed rebates is actually met. Then the cost of electricity at the margin will go up regardless of allowance allocation, and there would be some equity benefit. But my guess is that, even if that came to pass, consumers would watch their total bills, not the marginal cost, and thus defeat the price signal behaviorally. Also, will people with two addresses and two meters, like me, get a double rebate? Yippee!

Constraints vs. Complements

If you look at recent energy/climate regulatory plans in a lot of places, you’ll find an emerging model: an overall market-based umbrella (cap & trade) with a host of complementary measures targeted at particular sectors. The AB32 Scoping Plan, for example, has several options in each of eleven areas (green buildings, transport, …).

I think complementary policies have an important role: unlocking mitigation that’s bottled up by misperceptions, principal-agent problems, institutional constraints, and other barriers, as discussed yesterday. That’s hard work; it means changing the way institutions are regulated, or creating new institutions and information flows.

Unfortunately, too many of the so-called complementary policies take the easy way out. Instead of tackling the root causes of problems, they just mandate a solution – ban the bulb. There are some cases where standards make sense – where transaction costs of other approaches are high, for example – and they may even improve welfare. But for the most part such measures add constraints to a problem that’s already hard to solve. Sometimes those constraints aren’t even targeting the same problem: is our objective to minimize absolute emissions (cap & trade), minimize carbon intensity (LCFS), or maximize renewable content (RPS)?

You can’t improve the solution to an optimization problem by adding constraints. Even if you don’t view society as optimizing (probably a good idea), these constraints stand in the way of a good solution in several ways. Today’s sensible mandate is tomorrow’s straightjacket. Long permitting processes for land use and local air quality make it harder to adapt to a GHG price signal, for example.  To the extent that constraints can be thought of as property rights (as in the LCFS), they have high transaction costs or are illiquid. The proper level of the constraint is often subject to large uncertainty. The net result of pervasive constraints is likely to be nonuniform, and often unknown, GHG prices throughout the economy – contrary to the efficiency goal of emissions trading or taxation.

My preferred alternative: Start with pricing. Without a pervasive price on emissions, attempts to address barriers are really shooting in the dark – it’s difficult to identify the high-leverage micro measures in an environment where indirect effects and unintended consequences are large, absent a global signal. With a price on emissions, pain points will be more evident. Then they can be addressed with complementary policies, using the following sieve: for each area of concern, first identify the barrier that prevents the market from achieving a good outcome. Then fix the institution or decision process responsible for the barrier (utility regulation, for example), foster the creation of a new institution (to solve the landlord-tenant principal-agent problem, for example), or create a new information stream (labeling or metering, but less perverse than Energy Star). Only if that doesn’t work should we consider a mandate or auxiliary tradable permit system. Even then, we should also consider whether it’s better to simply leave the problem alone, and let the GHG price rise to harvest offsetting reductions elsewhere.

I think it’s reluctance to face transparent prices that drives politics to seek constraining solutions, which hide costs and appear to “stick it to the man.” Unfortunately, we are “the man.” Ultimately that problem rests with voters. Time for us to grow up.

MAC Attack

John Sterman just pointed me to David Levy’s newish blog, Climate Inc., which has some nice thoughts on Marginal Abatement Cost curves: How to get free mac lunches, and Whacking the MAC. They reminded me of my own thoughts on The elusive MAC curve. Climate Inc. also has a very interesting post on the psychology of US and European oil companies’ climate strategies, Back to Petroleum?.

The conclusion from How to get free mac lunches:

Of course, these solutions are not cost free ’“ they involve managerial time, some capital, and transaction costs. Some of the barriers are complex and would require large scale institutional restructuring, requiring government-business collaboration. But one person’s transaction costs are another’s business opportunity (the transaction costs of carbon markets will keep financial firms smiling). The key point here is that there are creative organizational and managerial approaches to unlock the doors to low-cost or even negative-cost carbon reductions. The carbon price is, by itself, an inefficient and ineffective tool ’“ the price would have to be at a politically infeasible level to achieve the desired goal. But we don’t have to rely just on the carbon price or on command and control; a multi-pronged attack is needed.

and Whacking the MAC:

Simply put, it will take a lot more than a market-based carbon price and a handout of free allowances to utilities to unlock the potential of conservation and energy efficiency investments.  It will take some serious innovation, a great deal of risk-taking and capital, and a coordinated effort by policy-makers, investors, and entrepreneurs to jump the significant institutional and legal hurdles currently in the way.  Until then, it will continue to be a real stretch to bend over the hurdles in an effort to reach all the elusive fruit lying on the ground.

Here’s my bottom line on MAC curves:

The existence of negative cost energy efficiency and mitigation options has been debated for decades. The arguments are more nuanced than they used to be, but this will not be settled any time soon. Still, there is an obvious way to proceed. First, put a price on carbon and other externalities. We’d make immediate progress on some fronts, where there are no barriers or misperceptions. In the stickier areas, there would be a financial incentive to solve the institutional, informational and transaction cost barriers that prevented implementation when energy was cheap and emissions were free. Service providers would emerge, and consumers and producers could gang up to push bureaucrats in the right direction. MAC curves would be a useful roadmap for action.

Hottest Day Ever

A few weeks ago, Seattle racked up its hottest day ever, at 103 degrees F. I was there for the fun. Normally I argue that air conditioning in the Pacific Northwest is for wimps, but we weren’t too thrilled about experiencing the record heat in a hotel without functioning AC. The next day (still hot) I was at a hotel that did have AC (the Crowne Plaza), and found this amazing scene:

Crowne Plaza fire

AC on full blast … and people huddled around a gas fire in the lobby?!

Don’t even get me started on the ice machinein a 100 degree closet, with an electric fan venting its waste heat into the hall, only to be expelled to the great outdoors by the building AC…

Incidentally, while it’s been mercifully cool and wet here in Montana, satellite records indicate that July 19 was possibly the hottest day ever recorded worldwide.