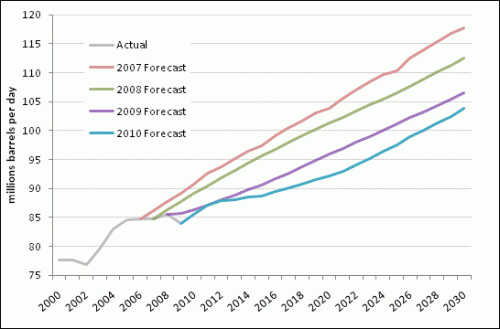
Econbrowser has a nice post from Steven Kopits, documenting big changes in EIA oil forecasts. This graphic summarizes what’s happened:

Click through for the original article.
As recently as 2007, the EIA saw a rosy future of oil supplies increasing with demand. It predicted oil consumption would rise by 15 mbpd to 2020, an ample amount to cover most eventualities. By 2030, the oil supply would reach nearly 118 mbpd, or 23 mbpd more than in 2006. But over time, this optimism has faded, with each succeeding year forecast lower than the year before. For 2030, the oil supply forecast has declined by 14 mbpd in only the last three years. This drop is as much as the combined output of Saudi Arabia and China.
…
In its forecast, the EIA, normally the cheerleader for production growth, has become amongst the most pessimistic forecasters around. For example, its forecasts to 2020 are 2-3 mbpd lower than that of traditionally dour Total, the French oil major. And they are below our own forecasts at Douglas-Westwood through 2020. As we are normally considered to be in the peak oil camp, the EIA’s forecast is nothing short of remarkable, and grim.
Is it right? In the last decade or so, the EIA’s forecast has inevitably proved too rosy by a margin. While SEC-approved prospectuses still routinely cite the EIA, those who deal with oil forecasts on a daily basis have come to discount the EIA as simply unreliable and inappropriate as a basis for investments or decision-making. But the EIA appears to have drawn a line in the sand with its new IEO and placed its fortunes firmly with the peak oil crowd. At least to 2020.
Since production is still rising, I think you’d have to call this “inflection point oil,” but as a commenter points out, it does imply peak conventional oil:
It’s also worth note that most of the liquids production increase from now to 2020 is projected to be unconventional in the IEO. Most of this is biofuels and oil sands. They REALLY ARE projecting flat oil production.
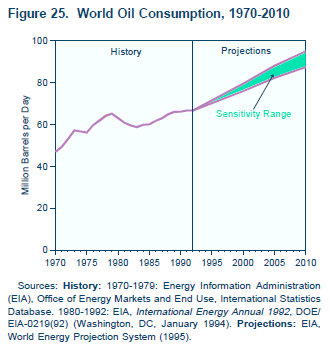
Since I’d looked at earlier AEO projections in the past, I wondered what early IEO projections looked like. Unfortunately I don’t have time to replicate the chart above and overlay the earlier projections, but here’s the 1995 projection:

The 1995 projections put 2010 oil consumption at 87 to 95 million barrels per day. That’s a bit high, but not terribly inconsistent with reality and the new predictions (especially if the financial bubble hadn’t burst). Consumption growth is 1.5%/year.
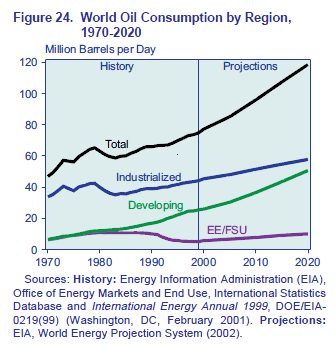
And here’s 2002:

In the 2002 projection, consumption is at 96 million barrels in 2010 and 119 million barrels in 2020 (waaay above reality and the 2007-2010 projections), a 2.2%/year growth rate.
I haven’t looked at all the interim versions, but somewhere along the way a lot of optimism crept in (and recently, crept out). In 2002 the IEO oil trajectory was generated by a model called WEPS, so I downloaded WEPS2002 to take a look. Unfortunately, it’s a typical open-loop spreadsheet horror show. My enthusiasm for a detailed audit is low, but it looks like oil demand is purely a function of GDP extrapolation and GDP-energy relationships, with no hint of supply-side dynamics (not even prices, unless they emerge from other models in a sneakernet portfolio approach). There’s no evidence of resources, not even synchronized drilling. No wonder users came to “discount the EIA as simply unreliable and inappropriate as a basis for investments or decision-making.”
Newer projections come from a new version, WEPS+. Hopefully it’s more internally consistent than the 2002 spreadsheet, and it does capture stock/flow dynamics and even includes resources. EIA appears to be getting better. But it appears that there’s still a fundamental problem with the paradigm: too much detail. There just isn’t any point in producing projections for dozens of countries, sectors and commodities two decades out, when uncertainty about basic dynamics renders the detail meaningless. It would be far better to work with simple models, capable of exploring the implications of structural uncertainty, in particular relaxing assumptions of equilibrium and idealized behavior.
Update: Michael Levi at the CFR blog points out that much of the difference in recent forecasts can be attributed to changes in GDP projections. Perhaps so. But I think this reinforces my point about detail, uncertainty, and transparency. If the model structure is basically consumption = f(GDP, price, elasticity) and those inputs have high variance, what’s the point of all that detail? It seems to me that the detail merely obscures the fundamentals of what’s going on, which is why there’s no simple discussion of reasons for the change in forecast.


