Hansen on The Deal

Jim Hansen kicked off the Tällberg panel with a succinct summary of the argument for a 350ppm target in Hansen et al. (a short version is here). As I heard it,

  • The dangerous level of GHGs in the atmosphere is lower than we thought.
  • 3C climate sensitivity from fast feedbacks is confirmed; the risk is slow feedbacks, which are not as slow as we thought.
  • There is enough warming in pipeline to lose arctic ice, glaciers, reefs.
  • Good news: we need to go back to the stable Holocene climate.
  • The problem is solvable because conventional oil and gas are limited; we just need the will to not burn coal, oil shale, etc., except with CCS.
  • Among other things, that requires a price on carbon; for which a tax is the preferred mechanism.
  • The only loser is the fossil fuel industry; we simply need to bring them to heel.

Hansen was a little impatient with our bit of the forum, and argued that our focus on regions (and the challenges in reaching a regional accord) was too pessimistic. Instead, a focus on fuels (e.g., phasing out coal) provides clarity of purpose.

My counterargument, which I only partially articulated during the session, for fear of driving the conversation off on a tangent, is as follows:

As a technical solution, phasing out coal and letting peak oil run its course probably works. However, phasing out coal by 2030 implies a time constant of seven years or a rate of decline in coal utilization of about 10%/year (by the 3-tau rule of thumb). Coal-fired power plants have a long lifetime, so the natural rate of decline, assuming no new coal investment, is more like 2.5% or 3%/year. Phasing out coal at 10% per year implies not only halting construction, but also abandoning many plants before their natural economic lifetime is up. Age structure complicates things a bit, perhaps making it easier in the US (where plants are disproportionately old) and harder in China (where they’re new). Closing plants ahead of schedule is going to make the fossil fuel interests that Hansen proposes to control rather vocally upset. Also, eliminating coal emissions that fast requires some combination of rapid deployment of efficiency, noncarbon energy sources, and CCS above natural rates of capital turnover, and lifestyle change to pick up the slack. That in itself is a significant challenge.

That would be doable for a coalition with enough political power to either overpower or buy off the owners of stranded assets. But that coalition doesn’t now exist, and therein lies the reason that this is a political problem more than a technical one.

Tol Talks Tax

Stumbled upon while searching for a reference: Richard Tol Changes Tune, Talks Carbon Tax. From what I’ve read, Tol is too much of a nonconformist to club with the professional skeptics, and has probably always preferred a Hotelling-style carbon price trajectory, so I’m not convinced that this is really a change, but it’s intriguing.

The Deal We Ain't Got

Today, Drew Jones and I presented a simple model as part of the Tällberg Forum’s Washington Conversation, ‘The climate deal we need.’ Our goal was to build from some simple points about the bathtub dynamics of the carbon cycle and climate to yield some insights about what’s needed. Our aspirational list of insights to get across included,

  • stabilizing emissions near current levels fails to stabilize atmospheric concentrations any time soon (because emissions now exceed uptake of carbon; stabilization continues that condition, and the residual accumulates in the atmosphere)
  • achieving stabilization of atmospheric CO2 at low levels (Hansen et al.’s 350 ppm) requires very aggressive cuts (for the same reason; if carbon cycle feedbacks from temperature kick in, negative emissions could be needed)
  • current policies are not on track to meaningful reductions (duh)
  • nevertheless, there is a path (Hansen et al.’s “where should humanity aim” paper lays out one option, and there are others)
  • starting soon is essential (the bathtub continues to fill while we delay – a costly gamble)
  • international negotiation dynamics are tricky due to diversity of interests, coupled problem spaces, and difficulty of transfers (simulations shadow this)
  • but everyone has to be on board or little happens (any one major region or sector, uncontrolled, can blow the deal by emitting above natural uptake)

A good moment came when someone asked, “Why should we care about staying below some temperature threshold?” (I think a scenario with about 3.5C was on the screen at the time). Jim Hansen answered, “because that would be a different planet.”

The conversation didn’t lead to specification of “the deal we need” but it explored a number of interesting facets, which I’ll relate in a few follow-on posts.

WCI Design Recommendations

Yesterday the WCI announced its design recommendations.

Update 9/26: WorldChanging has another take on the WCI here.
I haven’t read the whole thing, but here’s my initial impression based on the executive summary:

Scope

Major gases, including CO2, methane, nitrous oxide, hydrofluorocarbons, perfluorocarbons and sulfur hexafluoride.

What? In scope? How/where?
Large Industrial & Commercial, >25,000 MTCO2eq/yr

Combustion Emissions

Yes Point of emission

Process Emissions

Yes Point of emission
Electricity Yes “First Jurisdictional Deliverer” – includes power generated outside WCI
Small Industrial, Commercial, Residential Second Compliance Period (2015-2017) Upstream (“where fuels enter commerce in the WCI Partner jurisdictions, generally at a distributor. The precise point is TBD and may vary by jurisdiction”)
Transportation

Gasoline & Diesel

Second Compliance Period (2015-2017) Upstream (“where fuels enter commerce in the WCI Partner jurisdictions, generally at a terminal rack, final blender, or distributor. The precise point is TBD and may vary by jurisdiction”)

Biofuel combustion

No
Biofuel & fossil fuel upstream To be determined ?
Biomass combustion No, if determined to be carbon neutral  
Agriculture & Forestry No  

(See an earlier Midwestern Accord matrix here.)

Continue reading “WCI Design Recommendations”

The GAO's Panel of Economists on Climate

I just ran across a May 2008 GAO report, detailing the findings of a panel of economists convened to consider US climate policy. The panel used a modified Delphi method, which can be good or evil. The eighteen panelists are fairly neoclassical, with the exception of Richard Howarth, who speaks the language but doesn’t drink the Kool-aid.

First, it’s interesting what the panelists agree on. All of the panelists supported establishing a price on greenhouse gas emissions, and a majority were fairly certain that there would be a net benefit from doing so. A majority also favored immediate action, regardless of the participation of other countries. The favored immediate action is rather fainthearted, though. One-third favored an initial price range under $10/tonCO2, and only three favored exceeding $20/tonCO. One panelist specified a safety valve price at 55 cents. Maybe the low prices are intended to rise rapidly (or at the interest rate, per Hotelling); otherwise I have a hard time seeing why one would bother with the whole endeavor. It’s quite interesting that panelists generally accept unilateral action, which by itself wouldn’t solve the climate problem. Clearly they are counting on setting an example, with imitation bringing more emissions under control, and perhaps also on first-mover advantages in innovation.

Continue reading “The GAO's Panel of Economists on Climate”

ScapeToad

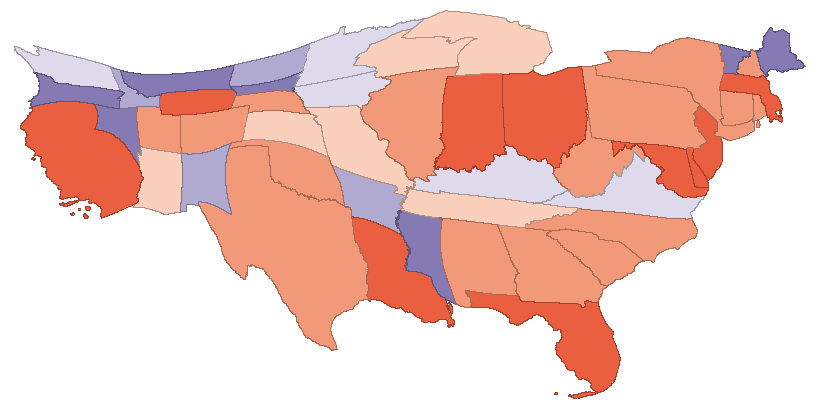
Nature had a nice article on a new tool that uses a diffusion algorithm to produce cartograms, maps rescaled in proportion to spatial variables. I know a bit about diffusion algorithms for image processing, and I can’t resist cool, free GIS software, so I downloaded a copy of the tool, ScapeToad, and tried it myself. First I grabbed a shapefile for US states from the Census’ TIGER/Line product. I clipped that to just the lower 48 states, using MapWindow. Also in MapWindow, I added a column to the shapefile’s attribute table to contain state emissions. In Excel, I used a lookup to insert state emissions from the Vulcan project into my emissions column in the attribute dbf. After a minute or two of chugging in ScapeToad (much more if you want higher resolution), I had this cartogram of state CO2 emissions:

State CO2 emissions cartogram

Regional Climate Initiatives – Model Roll Call – Part II

Minnesota

The Minnesota Next Generation Energy Act establishes a goal of reducing GHG emissions by 15% by 2015, 30% by 2025, and 80% by 2050, relative to 2005 levels.

From ScienceDaily comes news of a new research report from University of Minnesota’s Center fro Transportation Studies. The study looks at options for reducing transport emissions. Interestingly, transport represents 24% of MN emissions, vs. more than 40% in CA. The study decomposes emissions according to a variant of the IPAT identity,

Emissions = (Fuel/VehicleMile) x (Carbon/Fuel) x (VehicleMilesTraveled)

Vehicle and fuel effects are then modeled with LEAP, an energy modeling platform with a fast-growing following. The VMT portion is tackled with a spreadsheet calculator from CCAP’s Guidebook. I haven’t had much time to examine the latter, but it considers a rich set of options and looks like at least a useful repository of data. However, it’s a static framework, and land use-transportation interactions are highly dynamic. I’d expect it to be a useful way to construct alternative transport system visions, but not much help determining how to get there from here.

Minnesota’s Climate Change Advisory Group TWG on land use and transportation has a draft inventory and forecast of emissions. The Energy Supply and Residential/Commercial/Industrial TWGs developed spreadsheet analyses of a number of options. Analysis and Assumptions memos describe the results, but the spreadsheets are not online.

British Columbia

OK, it’s not a US region, but maybe we could trade it for North Dakota. BC has a revenue-neutral carbon tax, supplemented by a number of other initiatives. The tax starts at $10/TonCO2 and rises $5/year to $30 by 2012. The tax is offset by low-income tax credits and 2 to 5% reductions in lower income tax brackets; business tax reductions match personal tax reductions in roughly a 1:2 ratio.

BC’s Climate Action Plan includes a quantitative analysis of proposed policies, based on the CIMS model. CIMS is a detailed energy model coupled to a macroeconomic module that generates energy service demands. CIMS sounds a lot like DOE’s NEMS, which means that it could be useful for determining near-term effects of policies with some detail. However, it’s probably way too big to modify quickly to try out-of-the-box ideas, estimate parameters by calibration against history, or perform Monte Carlo simulations to appreciate the uncertainty around an answer.

The BC tax demonstrates a huge advantage of a carbon tax over cap & trade: it can be implemented quickly. The tax was introduced in the Feb. 19 budget, and switched on July 1st. By contrast, the WCI and California cap & trade systems have been underway much longer, and still are no where near going live. The EU ETS was authorized in 2003, turned on in 2005, and still isn’t dialed in (plus it has narrower sector coverage). Why so fast? It’s simple – there’s no trading infrastructure to design, no price uncertainty to worry about, and no wrangling over allowance allocations (though the flip side of the last point is that there’s also no transient compensation for carbon-intensive industries).

Bizarrely, BC wants to mess everything up by layering cap & trade on top of the carbon tax, coordinated with the WCI (in which BC is a partner).

Climate War Game – Reduction Illusion?

Is the cup half empty or half full? It seems to me that there are opportunities to get tripped up by even the simplest emissions math, as is the case with the MPG illusion. That complicates negotiations by introducing variations in regions’ perception of fairness, on top of contested value judgments.

Continue reading “Climate War Game – Reduction Illusion?”

Climate War Game – Is 2050 Temperature Locked In?

This slide became known as “the Angry Red Future” at the war game:
The Angry Red Future

Source: ORNL & Pew via Nature In the Field

After seeing the presentation around it, Eli Kintisch of Science asked me whether it was realistic to assume that 2050 climate is already locked in. (Keep in mind that we were living in 2015.) I guessed yes, then quickly ran a few simulations to verify. Then I lost my train of thought and lost track of Eli. So, for what it’s still worth, here’s the answer.

Continue reading “Climate War Game – Is 2050 Temperature Locked In?”

US Regional Climate Initiatives – Model Roll Call

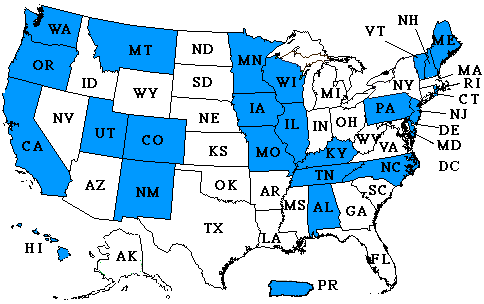
The Pew Climate Center has a roster of international, US federal, and US state & regional climate initiatives. Wikipedia has a list of climate initiatives. The EPA maintains a database of state and regional initiatives, which they’ve summarized on cool maps. The Center for Climate Strategies also has a map of links. All of these give some idea as to what regions are doing, but not always why. I’m more interested in the why, so this post takes a look at the models used in the analyses that back up various proposals.

EPA State Climate Initiatives Map

In a perfect world, the why would start with analysis targeted at identifying options and tradeoffs for society. That analysis would inevitably involve models, due to the complexity of the problem. Then it would fall to politics to determine the what, by choosing among conflicting stakeholder values and benefits, subject to constraints identified by analysis. In practice, the process seems to run backwards: some idea about what to do bubbles up in the political sphere, which then mandates that various agencies implement something, subject to constraints from enabling legislation and other legacies that do not necessarily facilitate the best outcome. As a result, analysis and modeling jumps right to a detailed design phase, without pausing to consider the big picture from the top down. This tendency is somewhat reinforced by the fact that most models available to support analysis are fairly detailed and tactical; that makes them too narrow or too cumbersome to redirect at the broadest questions facing society. There isn’t necessarily anything wrong with the models; they just aren’t suited to the task at hand.

My fear is that the analysis of GHG initiatives will ultimately prove overconstrained and underpowered, and that as a result implementation will ultimately crumble when called upon to make real changes (like California’s ambitious executive order targeting 2050 emissions 80% below 1990 levels). California’s electric power market restructuring debacle jumps to mind. I think underpowered analysis is partly a function of history. Other programs, like emissions markets for SOx, energy efficiency programs, and local regulation of criteria air pollutants have all worked OK in the past. However, these activities have all been marginal, in the sense that they affect only a small fraction of energy costs and a tinier fraction of GDP. Thus they had limited potential to create noticeable unwanted side effects that might lead to damaging economic ripple effects or the undoing of the policy. Given that, it was feasible to proceed by cautious experimentation. Greenhouse gas regulation, if it is to meet ambitious goals, will not be marginal; it will be pervasive and obvious. Analysis budgets of a few million dollars (much less in most regions) seem out of proportion with the multibillion $/year scale of the problem.

One result of the omission of a true top-down design process is that there has been no serious comparison of proposed emissions trading schemes with carbon taxes, though there are many strong substantive arguments in favor of the latter. In California, for example, the CPUC Interim Opinion on Greenhouse Gas Regulatory Strategies states, “We did not seriously consider the carbon tax option in the course of this proceeding, due to the fact that, if such a policy were implemented, it would most likely be imposed on the economy as a whole by ARB.” It’s hard for CARB to consider a tax, because legislation does not authorize it. It’s hard for legislators to enable a tax, because a supermajority is required and it’s generally considered poor form to say the word “tax” out loud. Thus, for better or for worse, a major option is foreclosed at the outset.

With that little rant aside, here’s a survey of some of the modeling activity I’m familiar with:

Continue reading “US Regional Climate Initiatives – Model Roll Call”