My last post introduced some observations from simulation of an equilibrium fuel portfolio standard model:
- knife-edge behavior of market volume of alternative fuels as you approach compliance limits (discussed last year): as the required portfolio performance approaches the performance of the best component options, demand for those approaches 100% of volume rapidly.
- differences in the competitive landscape for technology providers, when compared to alternatives like a carbon tax.
- differences in behavior under uncertainty.
- perverse behavior when the elasticity of substitution among fuels is low
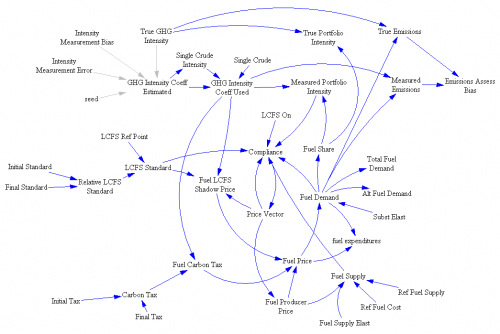
Here are some of the details. First, the model:
Notice that this is not a normal SD model – there are loops but no stocks. That’s because this is a system of simultaneous equations solved in equilibrium. The Vensim FIND ZERO function is used to find a vector of prices (one for each fuel, plus the shadow price of emissions intensity) that matches supply and demand, subject to the intensity constraint.

