Will the real emissions target please stand up?

cop15_8_1_650

The post-Copenhagen climate negotiations seem to be diverging, at least on the question of targets. Brackets, denoting disagreement, have if anything proliferated in the draft texts. The latest from Bonn:

AD HOC WORKING GROUP ON LONG-TERM COOPERATIVE ACTION UNDER THE CONVENTION

Eleventh session Bonn, 2–6 August 2010

Item 3 of the provisional agenda Preparation of an outcome to be presented to the Conference of the Parties for adoption at its sixteenth session to enable full, effective and sustained implementation of the Convention through long-term cooperative action now, up to and beyond 2012

Text to facilitate negotiations among Parties

4. Parties should collectively reduce global emissions by [50][85][95] per cent from 1990 levels by 2050 and should ensure that global emissions continue to decline thereafter. Developed country Parties as a group should reduce their greenhouse gas emissions by [[75-85][at least 80-95][more than 95] per cent from 1990 levels by 2050] [more than 100 per cent from 1990 levels by 2040].

18. These commitments are made with a view to reducing the aggregate greenhouse gas emissions of developed country Parties by [at least] [25–40] [in the order of 30] [40] [45] [50] [X* per cent from [1990] [or 2005] levels by [2017][2020] [and by [at least] [YY] per cent by 2050 from the [1990] [ZZ] level].

Hat tip: Travis Franck.

The AWG-KP draft

I’ve added the Dec. 16 Kyoto Protocol working group draft to my summary table.

There’s not much to report with respect to the global outcome. Most of the detail is focused on Annex I (developed) country commitments. There are so many options and brackets in the text that it’s hard to draw any concrete conclusions about the implied emissions trajectory.

There’s possibly an interesting disconnect around characterization of the second round of targets. Currently there are a number of options included in bracketed text. First, the endpoint could be either 2017 or 2020. Second, various options suggest a range of cuts between 15% and 49% below 1990. This range corresponds roughly with the range typically cited as providing a decent chance of hitting a 2C target (see AR4 WG3 Ch. 13 box 13.7, pg. 776, for example).

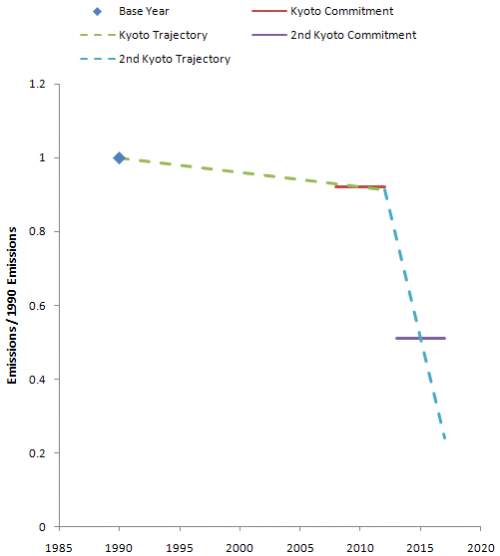
If you think back to the first Kyoto agreement, countries committed to small cuts relative to 1990 for a commitment period from 2008 to 2012. For the EU, with an 8% cut, that meant averaging 92% of 1990 emissions over the commitment period. If you imagine that emissions fall along a linear path from 1990, that means that emissions at the midpoint (2010) would be 92% of 1990, and emissions would be a little higher prior to that, and lower after. Because the slope from 1990 through 2012 is shallow, a viable trajectory would include a 7% cut in 2008 and 9% in 2012. No big deal.

However, for the next commitment period, the slope is a very big deal. The deepest cut in the AWG-KP draft is 49% for the developed world. I suspect that number is anchored on upper end of the AR4 2C range (25-40%), moved up a bit. 49% still sounds plausible. But there’s a problem: to achieve a 49% average over 2013-2020, starting from a 9% cut in 2012, you’d have to do one of two things: reduce emissions an additional 37% overnight, then keep them there (basically impossible), or reduce emissions by 13 percentage points per year, arriving at a cut of 76% in 2017. That’s a year-on-year reduction rate of 15 to 35% per year. That’s pretty tough going, given that, even if you never build another bit of carbon-emitting capital, natural turnover takes you down at 2 to 5% per year.

Required trajectory of 2nd Kyoto commitment

I’m all for strong targets, but abandoning capital at 10% per year is going to be a tough sell. It’s not clear to me that this is intentional. I think it’s quite possible that misperception of the dynamics of a target accumulated over an interval leads to false conflict, as desire to achieve a point goal (e.g., -40% in 2020) is confused with a much more stringent goal over a long interval.

Tracking climate initiatives

The launch of Climate Interactive’s scoreboard widget has been a hit – 10,500 views and 259 installs on the first day. Be sure to check out the video.

It’s a lot of work to get your arms around the diverse data on country targets that lies beneath the widget. Sometimes commitments are hard to translate into hard numbers because they’re just vague, omit key data like reference years, or are expressed in terms (like a carbon price) that can’t be translated into quantities with certainty. CI’s data is here.

There are some other noteworthy efforts:

Update: one more from WRI

Update II: another from the UN

Draft Climate Bill Out

AP has the story. The House Committee on Energy and Commerce has the draft. From the summary:

The legislation has four titles: (1) a ‘clean energy’ title that promotes renewable sources of energy and carbon capture and sequestration technologies, low-carbon transportation fuels, clean electric vehicles, and the smart grid and electricity transmission; (2) an ‘energy efficiency’ title that increases energy efficiency across all sectors of the economy, including buildings, appliances, transportation, and industry; (3) a ‘global warming’ title that places limits on the emissions of heat-trapping pollutants; and (4) a ‘transitioning’ title that protects U.S. consumers and industry and promotes green jobs during the transition to a clean energy economy.

One key issue that the discussion draft does not address is how to allocate the tradable emission allowances that restrict the amount of global warming pollution emitted by electric utilities, oil companies, and other sources. This issue will be addressed through discussions among Committee members.

A few quick observations, drawing on the committee summary (the full text is 648 pages and I don’t have the appetite): Continue reading “Draft Climate Bill Out”

State Emissions Commitments

For the Pangaea model, colleagues have been compiling a useful table of international emissions commitments. That will let us test whether, if fulfilled, those commitments move the needle on global atmospheric GHG concentrations and temperatures (currently they don’t).

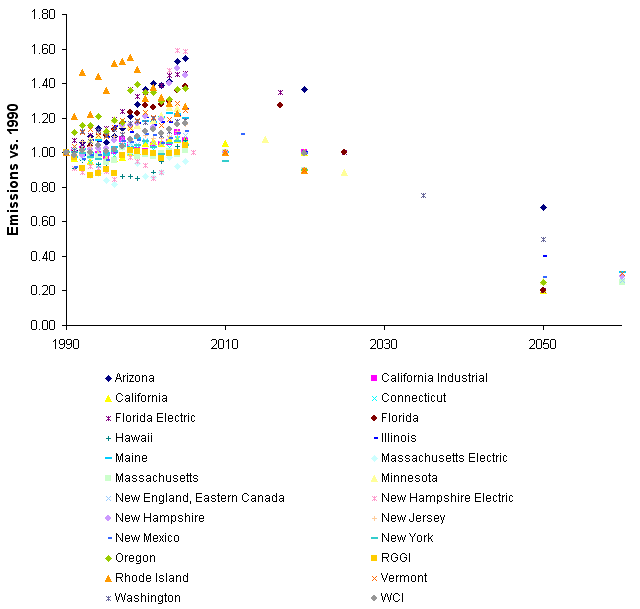
I’ve been looking for the equivalent for US states, and found it at Pew Climate. It’s hard to get a mental picture of the emissions trajectory implied by the various commitments in the table, so I combined them with emissions data from EPA (fossil fuel CO2 only) to reconcile all the variations in base years and growth patterns.

The history of emissions from 1990 to 2005, plus future commitments, looks like this:

State emissions commitments, vs. 1990, CO2 basis

Note that some states have committed to “long term” reductions, without a specific date, which are shown above just beyond 2050. There’s a remarkable amount of variation in 1990-2005 trends, ranging from Arizona (up 55%) to Massachusetts (nearly flat).

Continue reading “State Emissions Commitments”