A case for strict unit testing

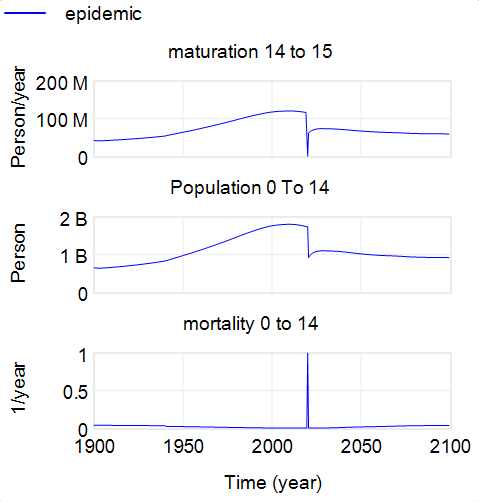
Over on the Vensim forum, Jean-Jacques Laublé points out an interesting bug in the World3 population sector. His forum post includes the model, with a revealing extreme conditions test and a correction. I think it’s important enough to copy my take here:

This is a very interesting discovery. The equations in question are:

maturation 14 to 15 =
 ( ( Population 0 To 14 ) )
 * ( 1
 - mortality 0 to 14 )
 / 15
 Units: Person/year
 The fractional rate at which people aged 0-14 mature into the
 next age cohort (MAT1#5).

**************************************************************
 mortality 0 to 14=
 IF THEN ELSE(Time = 2020 * one year, 1 / one year, mortality 0 to 14 table
 ( life expectancy/one year ) )
 Units: 1/year
 The fractional mortality rate for people aged 0-14 (M1#4).

**************************************************************

(The second is the one modified for the pulse mortality test.)

In the ‘maturation 14 to 15′ equation, the obvious issue is that ’15’ is a hidden dimensioned parameter. One might argue that this instance is ‘safe’ because 15 years is definitionally the residence time of people in the 0 to 15 cohort – but I would still avoid this usage, and make the 15 yrs a named parameter, like “child cohort duration”, with a corresponding name change to the stock. If nothing else, this would make the structure easier to reuse.

The sneaky bit here, revealed by JJ’s test, is that the ‘1’ in the term (1 – mortality 0 to 14) is not a benign dimensionless number, as we often assume in constructions like 1/(1+a*x). This 1 actually represents the maximum feasible stock outflow rate, in fraction/year, implying that a mortality rate of 1/yr, as in the test input, would consume the entire outflow, leaving no children alive to mature into the next cohort. This is incorrect, because the maximum feasible outflow rate is 1/TIME STEP, and TIME STEP = 0.5, so that 1 should really be 2 ~ frac/year. This is why maturation wrongly goes to 0 in JJ’s experiment, where some children remain to age into the next cohort.

In addition, this construction means that the origin of units in the equation are incorrect – the ’15’ has to be assumed to be dimensionless for this to work. If we assign correct units to the inputs, we have a problem:

maturation 14 to 15 = ~ people/year/year
 ( ( Population 0 To 14 ) ) ~ people
 * ( 1 - mortality 0 to 14 ) ~ fraction/year
 / 15 ~ 1/year

Obviously the left side of this equation, maturation, cannot be people/year/year.

JJ’s correction is:

maturation 14 to 15=
 ( ( Population 0 To 14 ) )
 * ( 1 - (mortality 0 to 14 * TIME STEP))
 / size of the 0 to 14 population

In this case, the ‘1’ represents the maximum fraction of the population that can flow out in a time step, so it really is dimensionless. (mortality 0 to 14 * TIME STEP) represents the fractional outflow from mortality within the time step, so it too is properly dimensionless (1/year * year). You could also write this term as:

( 1/TIME STEP - mortality 0 to 14 ) / (1/TIME STEP)

In this case you can see that the term is reducing maturation by the fraction of cohort residents who don’t make it to the next age group. 1/TIME STEP represents the maximum feasible outflow, i.e. 2/year if TIME STEP = 0.5 year. In this form, it’s easy to see that this term approaches 1 (no effect) in the continuous time limit as TIME STEP approaches 0.

I should add that these issues probably have only a tiny influence on the kind of experiments performed in Limits to Growth and certainly wouldn’t change the qualitative conclusions. However, I think there’s still a strong argument for careful attention to units: a model that’s right for the wrong reasons is a danger to future users (including yourself), who might use it in unanticipated ways that challenge the robustness in extremes.

WORLD3-03

This is the latest instance of the WORLD3 model, as in Limits to Growth – the 30 year update, from the standard Vensim distribution. It’s not much changed from the 1972 original used in Limits to Growth, which is documented in great detail in Dynamics of Growth in a Finite World (half off at Pegasus as of this moment).

There have been many critiques of this model, including the fairly famous Models of Doom. Many are ideological screeds that miss the point, and many modern critics do not appear to have read the book. The only good, comprehensive technical critique of World3 that I’m aware of is Wil Thissen’s thesis, Investigations into the Club of Rome’s WORLD3 model: lessons for understanding complicated models (Eindhoven, 1978). Portions appeared in IEEE Transactions.

My take on the more sensible critiques is that they show two things:

  • WORLD3 is an imperfect expression of the underlying ideas in Limits to Growth.
  • WORLD3 doesn’t have the policy space to capture competing viewpoints about the global situation; in particular it does not represent markets and technology as many see them.

It doesn’t necessarily follow from those facts that the underlying ideas of Limits are wrong. We still have to grapple with the consequences of exponential growth confronting finite planetary boundaries with long perception and action delays.

I’ve written some other material on limits here.

Files: WORLD3-03 (zipped archive of Vensim models and constant changes)

World3 Population Sector

Population sector extracted from the World3 model.

Documented in Dynamics of Growth in a Finite World, by Dennis L. Meadows, William W. Behrens III, Donella H. Meadows, Roger F. Naill, Jorgen Randers, and Erich K.O. Zahn. 1974 ISBN 0-9600294-4-3 . See also Limits to Growth, The 30-Year Update, by Dennis Meadows and Eric Tapley. ISBN 1-931498-85-7 .

See my article at The other bathtubs – population

World3-Population (Vensim .vpm)

World3-Population (Vensim .mdl)

World3-Population (Vensim .vmf)

The other bathtubs – population

I’ve written quite a bit about bathtub dynamics here. I got the term from “Cloudy Skies” and other work by John Sterman and Linda Booth Sweeney.

We report experiments assessing people’s intuitive understanding of climate change. We presented highly educated graduate students with descriptions of greenhouse warming drawn from the IPCC’s nontechnical reports. Subjects were then asked to identify the likely response to various scenarios for CO2 emissions or concentrations. The tasks require no mathematics, only an understanding of stocks and flows and basic facts about climate change. Overall performance was poor. Subjects often select trajectories that violate conservation of matter. Many believe temperature responds immediately to changes in CO2 emissions or concentrations. Still more believe that stabilizing emissions near current rates would stabilize the climate, when in fact emissions would continue to exceed removal, increasing GHG concentrations and radiative forcing. Such beliefs support wait and see policies, but violate basic laws of physics.

The climate bathtubs are really a chain of stock processes: accumulation of CO2 in the atmosphere, accumulation of heat in the global system, and accumulation of meltwater in the oceans. How we respond to those, i.e. our emissions trajectory, is conditioned by some additional bathtubs: population, capital, and technology. This post is a quick look at the first.

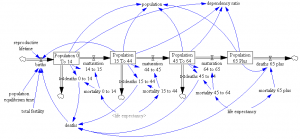
I’ve grabbed the population sector from the World3 model. Regardless of what you think of World3’s economics, there’s not much to complain about in the population sector. It looks like this:

World3 population sector

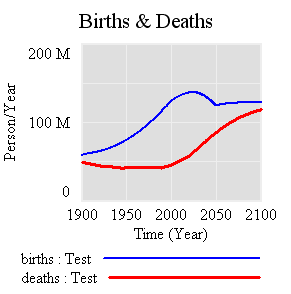
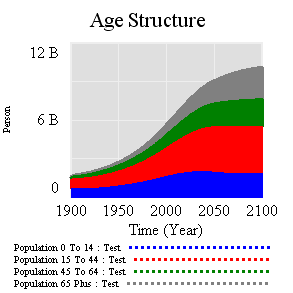
People are categorized into young, reproductive age, working age, and older groups. This 4th order structure doesn’t really capture the low dispersion of the true calendar aging process, but it’s more than enough for understanding the momentum of a population. If you think of the population in aggregate (the sum of the four boxes), it’s a bathtub that fills as long as births exceed deaths. Roughly tuned to history and projections, the bathtub fills until the end of the century, but at a diminishing rate as the gap between births and deaths closes:

Births & Deaths

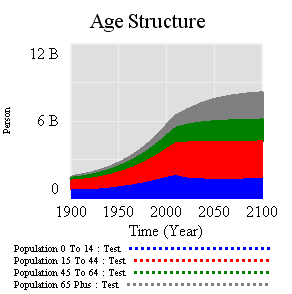
Age Structure

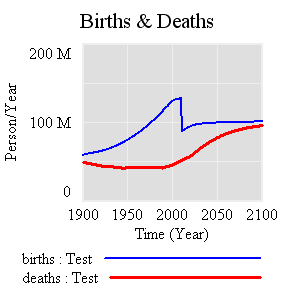
Notice that the young (blue) peak in 2030 or so, long before the older groups come into near-equilibrium. An aging chain like this has a lot of momentum. A simple experiment makes that momentum visible. Suppose that, as of 2010, fertility suddenly falls to slightly below replacement levels, about 2.1 children per couple. (This is implemented by changing the total fertility lookup). That requires a dramatic shift in birth rates:

Births & deaths in replacement experiment

However, that doesn’t translate to an immediate equilibrium in population. Instead,population still grows to the end of the century, but reaching a lower level. Growth continues because the aging chain is internally out of equilibrium (there’s also a small contribution from ongoing extension of life expectancy, but it’s not important here). Because growth has been ongoing, the demographic pyramid is skewed toward the young. So, while fertility is constant per person of child-bearing age, the population of prospective parents grows for a while as the young grow up, and thus births continue to increase. Also, at the time of the experiment, the elderly population has not reached equilibrium given rising life expectancy and growth down the chain.

Age Structure - replacement experiment

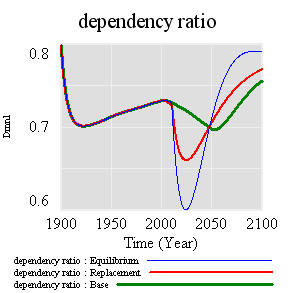
Achieving immediate equilibrium in population would require a much more radical fall in fertility, in order to bring births immediately in line with deaths. Implementing such a change would require shifting yet another bathtub – culture – in a way that seems unlikely to happen quickly. It would also have economic side effects. Often, you hear calls for more population growth, so that there will be more kids to pay social security and care for the elderly. However, that’s not the first effect of accelerated declines in fertility. If you look at the dependency ratio (the ratio of the very young and old to everyone else), the first effect of declining fertility is actually a net benefit (except to the extent that young children are intrinsically valued, or working in sweatshops making fake Gucci wallets):

Dependency ratio

The bottom line of all this is that, like other bathtubs, it’s hard to change population quickly, partly because of the physics of accumulation of people, and partly because it’s hard to even talk about the culture of fertility (and the economic factors that influence it). Population isn’t likely to contribute much to meeting 2020 emissions targets, but it’s part of the long game. If you want to win the long game, you have to anticipate long delays, which means getting started now.

The model (Vensim binary, text, and published formats): World3 Population.vmf World3-Population.mdl World3 Population.vpm