
I find causal loop diagramming to be a very useful brainstorming and presentation tool, but it falls short of what a model can do for you.
Here’s why. Consider the following pair of archetypes (Eroding Goals and Escalation, from wikipedia):
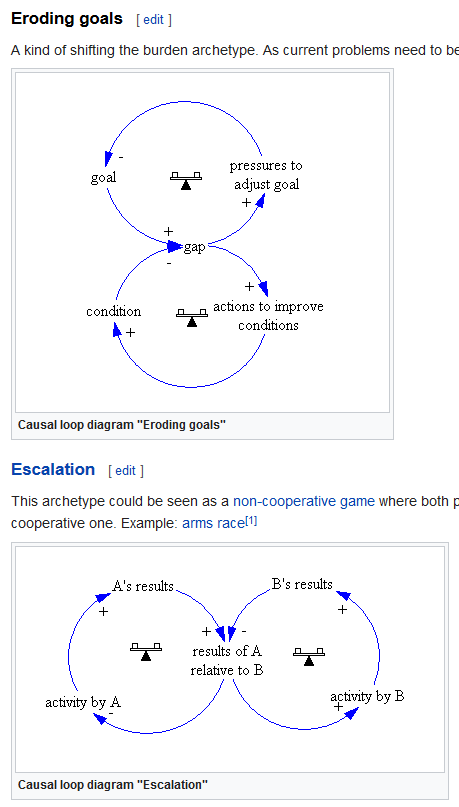
Archetypes are generic causal loop diagram (CLD) templates, with a particular behavior story. The Escalation and Eroding Goals archetypes have identical feedback loop structures, but very different stories. So, there’s no unique mapping from feedback loops to behavior. In order to predict what a set of loops is going to do, you need more information.
Here’s an implementation of Eroding Goals:
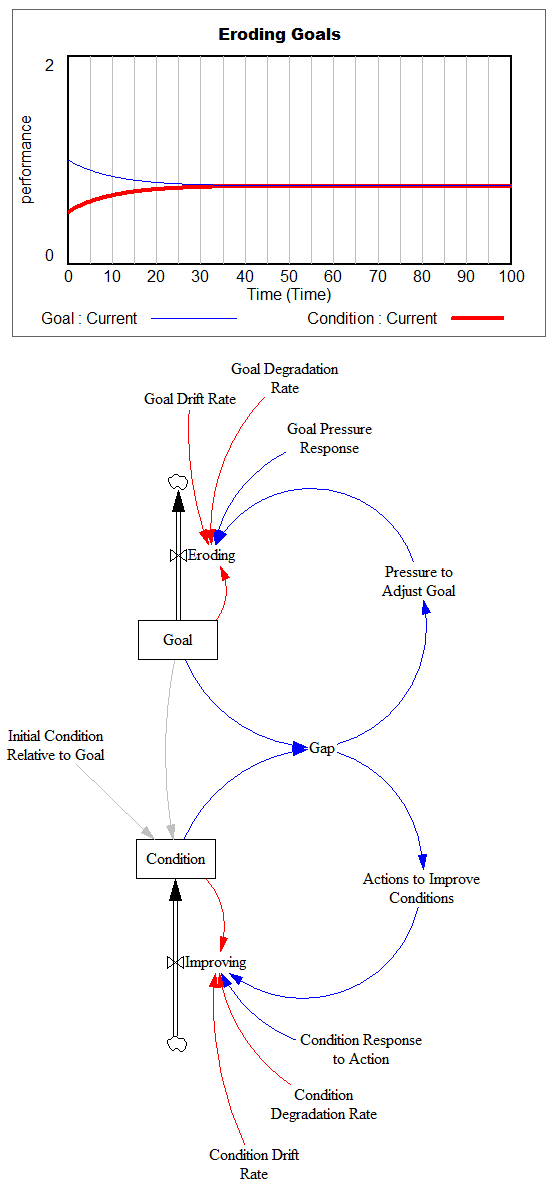
Notice several things:
- I had to specify where the stocks and flows are.
- “Actions to Improve Goals” and “Pressure to Adjust Conditions” aren’t well defined (I made them proportional to “Gap”).
- Gap is not a very good variable name.
- The real world may have structure that’s not mentioned in the archetype (indicated in red).
Here’s Escalation:
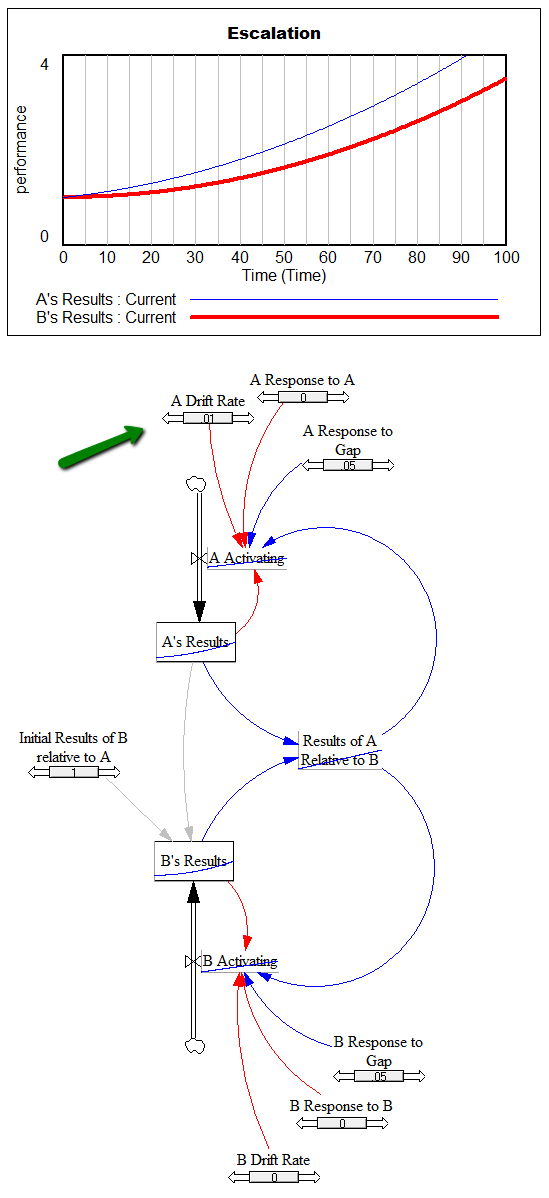
The loop structure is mathematically identical; only the parameterization is different. Again, the missing information turns out to be crucial. For example, if A and B start with the same results, there is no escalation – A and B results remain constant. To get escalation, you either need (1) A and B to start in different states, or (2) some kind of drift or self-excitation in decision making (green arrow above).
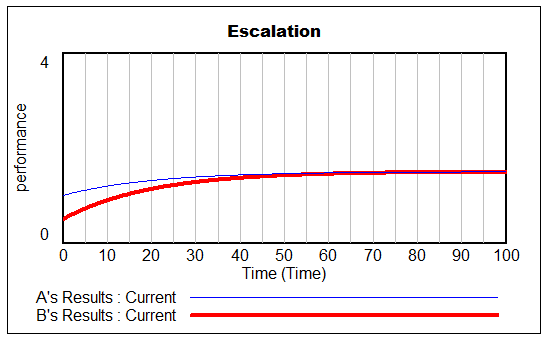
Even then, you may get different results. (2) gives exponential growth, which is the standard story for escalation. (1) gives escalation that saturates:
The Escalation archetype would be better if it distinguished explicit goals for A and B results. Then you could mathematically express the key feature of (2) that gives rise to arms races:
- A’s goal is x% more bombs than B
- B’s goal is y% more bombs than A
Both of these models are instances of a generic second-order linear model that encompasses all possible things a linear model can do:
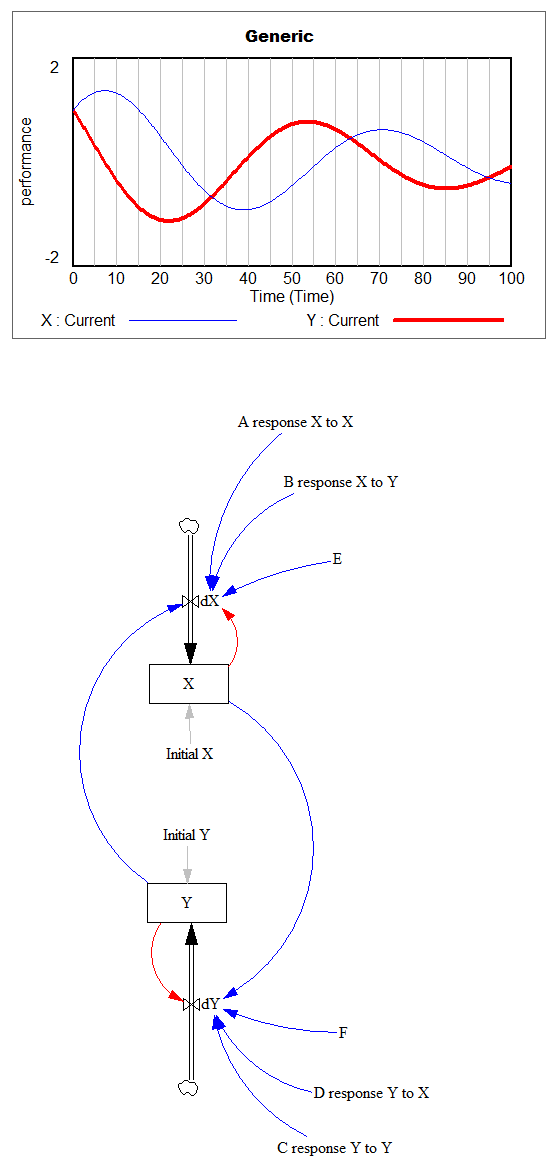
Notice that the first-order and second-order loops are disentangled here, which makes it easy to see the “inner” first order loops (which often contribute damping) and the “outer” second order loop, which can give rise to oscillation (as above) or the growth in the escalation archetype. That loop is difficult to discern when it’s presented as a figure-8.
Of course, one could map these archetypes to other figure-8 structures, like:
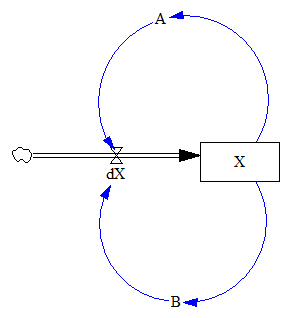
How could you tell the difference? You probably can’t, unless you consider what the stocks and flows are in an operational implementation of the archetype.
The bottom line is that the causal loop diagram of an archetype or anything else doesn’t tell you enough to simulate the behavior of the system. You have to specify additional assumptions. If the system is nonlinear or stochastic, there might be more assumptions than I’ve shown above, and they might be important in new ways. The process of surfacing and testing those assumptions by building a stock-flow model is very revealing.
If you don’t build a model, you’re in the awkward position of intuiting behavior from structure that doesn’t uniquely specify any particular mode. In doing so, you might be way ahead of non-systems thinkers approaching the same problem with a laundry list. But your ability to discover errors, incorporate data and discover leverage is far greater if you can simulate.
The model: wikiArchetypes1b.mdl (runs in any version of Vensim)
Cool!