Logistic Chaos

This is an implementation of the logistic model – a very simple example of discrete time chaotic behavior. It’s sometimes used to illustrate chaotic dynamics of insect populations.

There’s a nice description here, and the other top links on google tend to be good.

Note that this version corrects an equation error in previous versions.

Logistic (Vensim .vpm)

Logistic (Vensim .vmf)

LCFS in Equilibrium II

My last post introduced some observations from simulation of an equilibrium fuel portfolio standard model:

  • knife-edge behavior of market volume of alternative fuels as you approach compliance limits (discussed last year): as the required portfolio performance approaches the performance of the best component options, demand for those approaches 100% of volume rapidly.
  • differences in the competitive landscape for technology providers, when compared to alternatives like a carbon tax.
  • differences in behavior under uncertainty.
  • perverse behavior when the elasticity of substitution among fuels is low

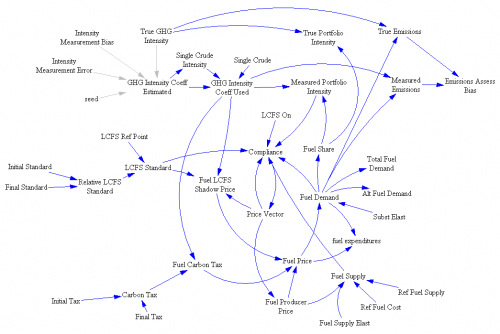
Here are some of the details. First, the model:

structure

Notice that this is not a normal SD model – there are loops but no stocks. That’s because this is a system of simultaneous equations solved in equilibrium. The Vensim FIND ZERO function is used to find a vector of prices (one for each fuel, plus the shadow price of emissions intensity) that matches supply and demand, subject to the intensity constraint.

Continue reading “LCFS in Equilibrium II”

Heat Trap

Replicated by: Tom Fiddaman

Citation: Hatlebakk, Magnus, & Moxnes, Erling (1992). Misperceptions and Mismanagement of the Greenhouse Effect? The Simulation Model . Report # CMR-92-A30009, December). Christian Michelsen Research.

Units: no

Format: Vensim

This is a climate-economy model, of about the same scale and vintage as Nordhaus’ original DICE model. It’s more interesting in some respects, because it includes path-dependent reversible and irreversible emissions reductions. As I recall, the original also had some stochastic elements, not active here. This version has no units; hopefully I can get an improved version online at some point.

Heat trap (Vensim .vmf)

World3 Population Sector

Population sector extracted from the World3 model.

Documented in Dynamics of Growth in a Finite World, by Dennis L. Meadows, William W. Behrens III, Donella H. Meadows, Roger F. Naill, Jorgen Randers, and Erich K.O. Zahn. 1974 ISBN 0-9600294-4-3 . See also Limits to Growth, The 30-Year Update, by Dennis Meadows and Eric Tapley. ISBN 1-931498-85-7 .

See my article at The other bathtubs – population

World3-Population (Vensim .vpm)

World3-Population (Vensim .mdl)

World3-Population (Vensim .vmf)

Ultradian Oscillations of Insulin and Glucose

Citation: Jeppe Sturis, Kenneth S. Polonsky, Erik Mokilde, and Eve van Cauter. Computer Model for Mechanisms Underlying Ultradian Oscillations of Insulin and Glucose. Am. J. Physiol. 260 (Endocrinol. Metab. 23): E801-E809, 1991.

Source: Replicated by Hank Taylor

Units: No Yes!

Format: Vensim

Ultradian Oscillations of Insulin and Glucose (Vensim .vpm)

Update, 10/2017:

Refreshed, with units defined (mathematically the same as before): ultradia2.vpm ultradia2.mdl

Further refined, for initialization in equilibrium (insulin by analytic expression; glucose by parameter). Glucose infusion turned on by default. Graphs added.

ultradia-enhanced-3.mdl ultradia-enhanced-3.vpm

Sea Level Rise

Citations: Rahmstorf 2007, “A semi-empirical approach to projecting future sea level rise.” Science 315. Grinsted, Moore & Jevrejeva 2009. “Reconstructing sea level from paleo and projected temperatures 200 to 2100 AD.” Climate Dynamics [1]

Source: Replicated by Tom Fiddaman based on an earlier replication of Rahmstorf provided by John Sterman

Units balance: Yes

Format: Vensim; requires Model Reader or an advanced version

Notes: See discussion at metasd.

Files:

Grinsted_v3b‎ – first model; default calibration replicates Rahmstorf, and optimization is set up to adjust constant terms to fit Rahmstorf slope to data

Grinsted_v3c – second model; updated data and calibration, as in Part III

Grinsted_v3c-k2 – third model; set up for Kalman filtering, as in Part V

A Behavioral Analysis of Learning Curve Strategy

Model Name: A Behavioral Analysis of Learning Curve Strategy

Citation: A Behavioral Analysis of Learning Curve Strategy, John D. Sterman and Rebecca Henderson, Sloan School of Management, MIT and Eric D. Beinhocker and Lee I. Newman, McKinsey and Company.

Neoclassical models of strategic behavior have yielded many insights into competitive behavior, despite the fact that they often rely on a number of assumptions-including instantaneous market clearing and perfect foresight-that have been called into question by a broad range of research. Researchers generally argue that these assumptions are “good enough” to predict an industry’s probable equilibria, and that disequilibrium adjustments and bounded rationality have limited competitive implications.  Here we focus on the case of strategy in the presence of increasing returns to highlight how relaxing these two assumptions can lead to outcomes quite different from those predicted by standard neoclassical models. Prior research suggests that in the presence of increasing returns, tight appropriability and accommodating rivals, in some circumstances early entrants can achieve sustained competitive advantage by pursuing Get Big Fast (GBF) strategies: rapidly expanding capacity and cutting prices to gain market share advantage and exploit positive feedbacks faster than their rivals. Using a simulation of the duopoly case we show that when the industry moves slowly compared to capacity adjustment delays, boundedly rational firms find their way to the equilibria predicted by conventional models.  However, when market dynamics are rapid relative to capacity adjustment, forecasting errors lead to excess capacity, overwhelming the advantage conferred by increasing returns. Our results highlight the risks of ignoring the role of disequilibrium dynamics and bounded rationality in shaping competitive outcomes, and demonstrate how both can be incorporated into strategic analysis to form a dynamic, behavioral game theory amenable to rigorous analysis.

The original paper is on Archive.org ; it was eventually published in Management Science. You can get the MS version from John Sterman’s page here.

Source: Replicated by Tom Fiddaman

Units balance: Yes

Format: Vensim (the model uses subscripts, so it requires Pro, DSS, or Model Reader)

Behavioral Analysis of Learning Curve Strategy (Vensim .vmf)

New update:

BALCS4b.zip

The Energy Transition and the Economy

Model Name: The Energy Transition and the Economy: A System Dynamics Approach

Citation: John D. Sterman, 1981. PhD Dissertation, MIT Sloan School of Management

Source: Replicated by Miguel Vukelic (a heroic effort)

Units balance: Yes

Format: Vensim (Contains data variables and thus requires an advanced version or the free Model Reader)

The Energy Transition and the Economy (Vensim .vpm)