I like R&D. Heck, I basically do R&D. But the common argument, that people won’t do anything hard to mitigate emissions or reduce energy use, so we need lots of R&D to find solutions, strikes me as delusional.
The latest example to cross my desk (via the NYT) is the new American Energy Innovation Council’s recommendations,
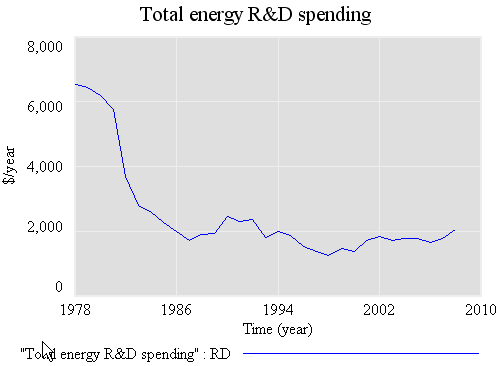
Let’s look at the meat of this – $16 billion per year in energy innovation funding. Historic funding looks like this:
Total public energy R&D, compiled from Gallagher, K.S., Sagar, A, Segal, D, de Sa, P, and John P. Holdren, “DOE Budget Authority for Energy Research, Development, and Demonstration Database,” Energy Technology Innovation Project, John F. Kennedy School of Government, Harvard University, 2007. I have a longer series somewhere, but no time to dig it up. Basically, spending was negligible (or not separately accounted for) before WWII, and ramped up rapidly after 1973.
The data above reflects public R&D; when you consider private spending, the jump to $16 billion represents maybe a factor of 3 or 4 increase. What does that do for you?
Consider a typical model of technical progress, the two-factor learning curve:
cost = (cumulative R&D)^A*(cumulative experience)^B
The A factor represents improvement from deliberate R&D, while the B factor reflects improvement from production experience like construction and installation of wind turbines. A and B are often expressed as learning rates, the multiple on cost that occurs per doubling of the relevant cumulative input. In other words, A,B = ln(learning rate)/ln(2). Typical learning rates reported are .6 to .95, or cost reductions of 40% to 5% per doubling, corresponding with A/B values of -.7 to -.15, respectively. Most learning rate estimates are on the high end (smaller reductions per doubling), particularly when the two-factor function is used (as opposed to just one component).
Let’s simplify so that
cost = (cumulative R&D)^A
and use an aggressive R&D learning rate (.7), for A=-0.5. In steady state, with R&D growing at the growth rate of the economy (call it g), cost falls at the rate A*g (because the integral of exponentially growing spending grows at the same rate, and exp(g*t)^A = exp(A*g*t)).
That’s insight number one: a change in R&D allocation has no effect on the steady-state rate of progress in cost. Obviously one could formulate alternative models of technology where that is not true, but compelling argument for this sort of relationship is that the per capita growth rate of GDP has been steady for over 250 years. A technology model with a stronger steady-state spending->cost relationship would grow super-exponentially.
Insight number two is what the multiple in spending (call it M) does get you: a shift in the steady-state growth trajectory to a new, lower-cost path, by M^A. So, for our aggressive parameter, a multiple of 4 as proposed reduces steady-state costs by a factor of about 2. That’s good, but not good enough to make solar compatible with baseload coal electric power soon.
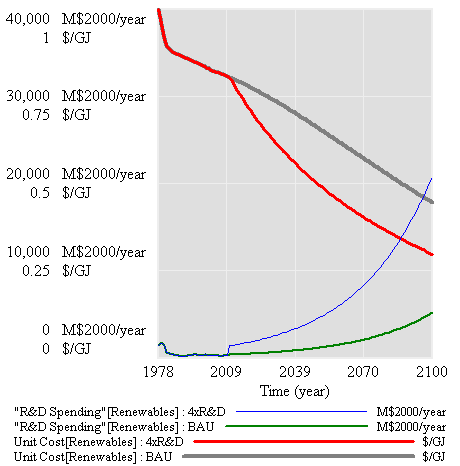
Given historic cumulative public R&D, 3%/year baseline growth in spending, a 0.8 learning rate (a little less aggressive), a quadrupling of R&D spending today produces cost improvements like this:
Those are helpful, but not radical. In addition, even if R&D produces something more miraculous than it has historically, there are still big nontechnical lock-in humps to overcome (infrastructure, habits, …). Overcoming those humps is a matter of deployment more than research. The Energy Innovation Council is definitely enthusiastic about deployment, but without internalizing the externalities associated with energy production and use, how is that going to work? You’d either need someone to pick winners and implement them with a mishmash of credits and subsidies, or you’d have to hope for/wait for cleantech solutions to exceed the performance of conventional alternatives.
The latter approach is the “stone age didn’t end because we ran out of stones” argument. It says that cleantech (iron) will only beat conventional (stone) when it’s unequivocally better, not just for the environment, but also convenience, cost, etc. What does that say about the prospects for CCS, which is inherently (thermodynamically) inferior to combustion without capture? The reality is that cleantech is already better, if you account for the social costs associated with energy. If people aren’t willing to internalize those social costs, so be it, but let’s not pretend we’re sure that there’s a magic technical bullet that will yield a good outcome in spite of the resulting perverse incentives.
Gallagher, K.S., Sagar, A, Segal, D, de Sa, P, and John P. Holdren, “DOE Budget Authority for Energy Research, Development, and Demonstration Database,” Energy Technology Innovation Project, John F. Kennedy School of Government, Harvard University, 2007.


This might not matter to your point, but there seem to exist various data series on “Energy R&D” that differ significantly.
The graph that you showed (btw, y-axis should be labeled as $Million/yr I think) seemed somewhat low to me, so I went looking. A little Google-ing found a general warning about this category of data:
http://www.pnl.gov/main/publications/external/technical_reports/PNNL-13158.pdf
but at least he presents his high-level definition fairly clearly.
The PNNL folks present data that has the same basic shape but looks shifted upward by ~$500M, possibly a definitional issue to include “basic energy research” or some other budgetary item in the total.
Dooley JJ. 2008. U.S. Federal Investments in Energy R&D: 1961-2008
http://www.pnl.gov/main/publications/external/technical_reports/PNNL-17952.pdf
Nemet and Kammen of the Energy and Resources Group at UC Berkeley also seem to present data that is higher (e.g. does not drop much below $2.5B or $3B (on p. 8 of:
http://www.usaee.org/USAEE2006/papers/gregnemet.pdf
interesting reading, also)
There are also some multiple-use facilities like LLNL’s NIF, which I see in the DoE budget charges the “Fusion Energy Sciences Program” around $10-14M/yr, but charges the Weapons activity “Inertial Confinement Fusion and High Yield Campaign” around $285M/yr.
Just sayin’.
Thanks for the links. I haven’t done any work in this area for a couple years, so I hadn’t seen these.
The “M$2000” refers to million $ – but living with Vensim unit syntax.
The big question I think is what the private sector funding looks like. The general national accounts I’ve seen aren’t specific enough to single out energy. Also, when looking at more granular things like wind and solar, technology spillovers across countries are important, so it would be an error to attribute all progress on wind in the US to US wind R&D.
Proportional shifts up or down make little or no difference to the outcome, because the fractional rate of tech improvement depends on the fractional rate of increase of cumulative R&D, which is independent of scale.