Since the budget deal was announced, I’ve been wondering what was in it. It’s hard to imagine that it really works like this:
“This is an agreement to invest in our country’s future while making the largest annual spending cut in our history,” Obama said.
However, it seems that there isn’t really much substance to the deal yet, so I thought I’d better look instead at one target: the Ryan budget roadmap. The CBO recently analyzed it, and put the $ conveniently in a spreadsheet.
Like most spreadsheets, this is very good at presenting the numbers, and lousy at revealing causality. The projections are basically open-loop, but they run to 2084. There’s actually some justification for open-loop budget projections, because many policies are open loop. The big health and social security programs, for example, are driven by demographics, cutoff ages and inflation adjustment formulae. The demographics and cutoff ages are predictable. It’s harder to fathom the possible divergence between inflation adjustments and broad inflation (which affects the health sector share) and future GDP growth. So, over long horizons, it’s a bit bonkers to look at the system without considering feedback, or at least uncertainty in the future trajectory of some key drivers.
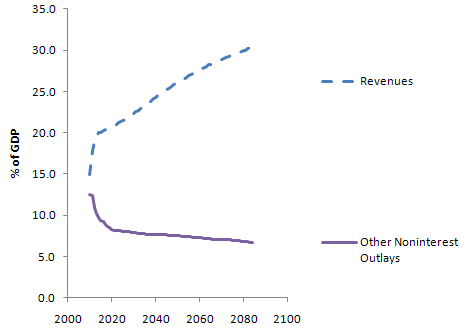
There’s also a confounding annoyance in the presentation, with budgets and debt as percentages of GDP. Here’s revenue and “other” expenditures (everything but social security, health and interest):
 There’s a huge transient in each, due to the current financial mess. (Actually this behavior is to some extent deliberately Keynesian – the loss of revenue in a recession is amplified over the contraction of GDP, because people fall into lower tax brackets and profits are more volatile than gross activity. Increased borrowing automatically takes up the slack, maintaining more stable spending.) The transient makes it tough to sort out what’s real change, and what is merely the shifting sands of the GDP denominator. This graph also points out another irritation: there’s no history. Is this plausible, or unprecedented behavior?
The Ryan team actually points out some of the same problems with budgets and their analyses:
One reason the Federal Government’s major entitlement programs are difficult to control is that they are designed that way. A second is that current congressional budgeting provides no means of identifying the long-term effects of near-term program expansions. A third is that these programs are not subject to regular review, as annually appropriated discretionary programs are; and as a result, Congress rarely evaluates the costs and effectiveness of entitlements except when it is proposing to enlarge them. Nothing can substitute for sound and prudent policy choices. But an improved budget process, with enforceable limits on total spending, would surely be a step forward. This proposal calls for such a reform.
Unfortunately the proposed reforms don’t seem to change anything about the process for analyzing the budget or designing programs. We need transparent models with at least a little bit of feedback in them, and programs that are robust because they’re designed with that little bit of feedback in mind.
Setting aside these gripes, here’s what I can glean from the spreadsheet.
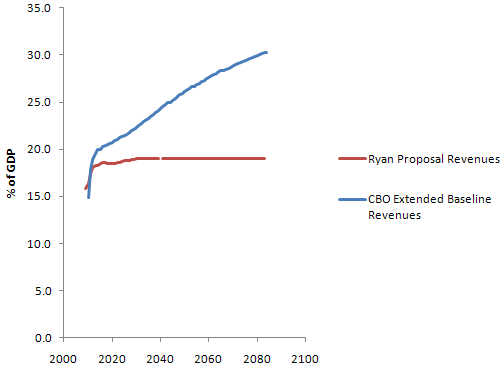
The Ryan proposal basically flatlines revenue at 19% of GDP, then squashes programs to fit. By contrast, the CBO Extended Baseline scenario expands programs per current rules and then raises revenue to match (very roughly – the Ryan proposal actually winds up with slightly more public debt 20 years from now).
 It’s not clear how the 19% revenue level arises; the CBO used a trajectory from Ryan’s staff, not its own analysis. Ryan’s proposal says:
- Provides individual income tax payers a choice of how to pay their taxes – through existing law, or through a highly simplified code that fits on a postcard with just two rates and virtually no special tax deductions, credits, or exclusions (except the health care tax credit).
- Simplifies tax rates to 10 percent on income up to $100,000 for joint filers, and $50,000 for single filers; and 25 percent on taxable income above these amounts. Also includes a generous standard deduction and personal exemption (totaling $39,000 for a family of four).
- Eliminates the alternative minimum tax [AMT].
- Promotes saving by eliminating taxes on interest, capital gains, and dividends; also eliminates the death tax.
- Replaces the corporate income tax – currently the second highest in the industrialized world – with a border-adjustable business consumption tax of 8.5 percent. This new rate is roughly half that of the rest of the industrialized world.
It’s not clear that there’s any analysis to back up the effects of this proposal. Certainly it’s an extremely regressive shift. Real estate fans will flip when they find out that the mortgage interest deduction is gone (actually a good idea, I think).
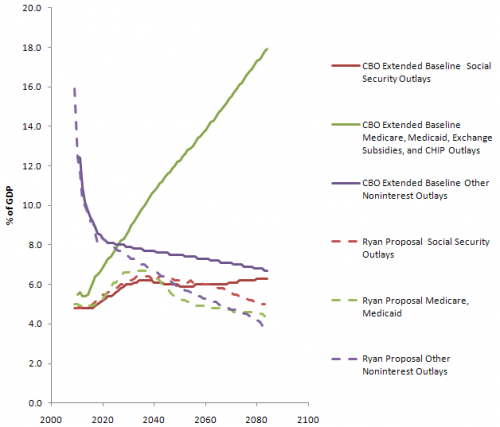
On the outlay side, here’s the picture (CBO in solid lines; Ryan proposal with dashes):
 You can see several things here:
- Social security is untouched until some time after 2050. CBO says that the proposal doesn’t change the program; Ryan’s web site partially privatizes it after about a decade and “eventually” raises the retirement age. There seems to be some disconnect here.
- Health care outlays are drastically lower; this is clearly where the bulk of the savings originate. Even so, there’s not much change in the trend until at least 2025 (the initial absolute difference is definitional – inclusion of programs other than Medicare/Medicaid in the CBO version).
- Other noninterest outlays also fall substantially – presumably this means that all other expenditures would have to fit into a box not much bigger than today’s defense budget, which seems like a heroic assumption even if you get rid of unemployment, SSI, food stamps, Section 8, and all similar support programs.
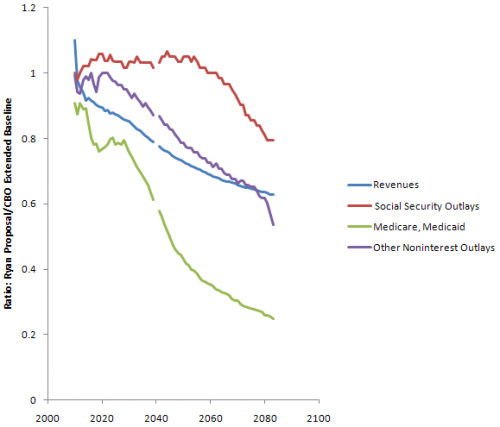
You can also look at the ratio of outlays under Ryan vs. CBO’s Extended Baseline:
Since health care carries the flag for savings, the question is, will the proposal work? I’ll take a look at that next.


Projecting beyond 2020 or 2025 is a waste of time and electrons.
publishing projections beyond that time frame mixes apples and oranges with mud. Why? Read “The Fourth Turning” by Strauss and Howe.
Generally I agree. There are some long term dynamics – like demographics – that are predictable on longer time scales, and therefore useful to know about. But those don’t need to be connected to precise budget projections; they need to be taken into account in a more strategic process.