I ran across the Nelson Rules in a machine learning package. These are a set of heuristics for detecting changes in statistical process control. Their inclusion felt a bit like navigating a 787 with a mechanical flight computer (which is a very cool device, by the way).

The idea is pretty simple. You have a time series of measurements, normalized to Z-scores, and therefore varying (most of the time) by plus or minus 3 standard deviations. The Nelson Rules provide a way to detect anomalies: drift, oscillation, high or low variance, etc. Rule 1, for example, is just a threshold for outlier detection: it fires whenever a measurement is more than 3 SD from the mean.

In the machine learning context, it seems strange to me to use these heuristics when more powerful tests are available. This is not unlike the problem of deciding whether a random number generator is really random. It’s fairly easy to determine whether it’s producing a uniform distribution of values, but what about cycles or other long-term patterns? I spent a lot of time working on this when we replaced the RNG in Vensim. Many standard tests are available. They’re not all directly applicable, but the thinking is.
In any case, I got curious how the Nelson rules performed in the real world, so I developed a test model.

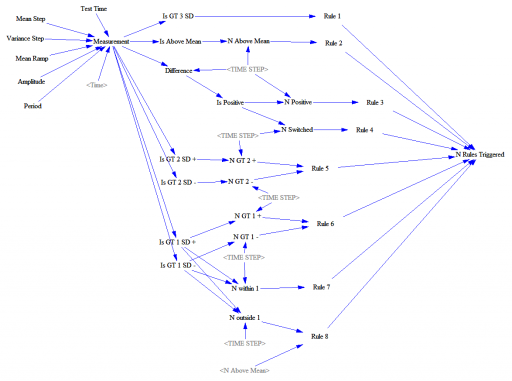
This feeds a test input (Normally distributed random values, with an optional signal superimposed) into a set of accounting variables that track metrics and compare with the rule thresholds. Some of these are complex.
Rule 4, for example, looks for 14 points with alternating differences. That’s a little tricky to track in Vensim, where we’re normally more interested in continuous time. I tackle that with the following structure:
Difference = Measurement-SMOOTH(Measurement,TIME STEP)
**************************************************************
Is Positive=IF THEN ELSE(Difference>0,1,-1)
**************************************************************
N Switched=INTEG(IF THEN ELSE(Is Positive>0 :AND: N Switched<0
,(1-2*N Switched )/TIME STEP
,IF THEN ELSE(Is Positive<0 :AND: N Switched>0
 ,(-1-2*N Switched)/TIME STEP
 ,(Is Positive-N Switched)/TIME STEP)),0)
**************************************************************
Rule 4=IF THEN ELSE(ABS(N Switched)>14,1,0)
**************************************************************
There’s a trick here. To count alternating differences, we need to know (a) the previous count, and (b) whether the previous difference encountered was positive or negative. Above, N Switched stores both pieces of information in a single stock (INTEG). That’s possible because the count is discrete and positive, so we can overload the storage by giving it the sign of the previous difference encountered.
Thus, if the current difference is negative (Is Positive < 0) and the previous difference was positive (N Switched > 0), we (a) invert the sign of the count by subtracting 2*N Switched, and (b) augment the count, here by subtracting 1 to make it more negative.
Similar tricks are used elsewhere in the structure.
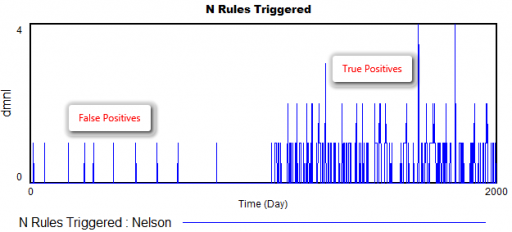
How does it perform? Surprisingly well. Here’s what happens when the measurement distribution shifts by one standard deviation halfway through the simulation:

There are a few false positives in the first 1000 days, but after the shift, there are many more detections from multiple rules.
The rules are pretty good at detecting a variety of pathologies: increases or decreases in variance, shifts in the mean, trends, and oscillations. The rules also have different false positive rates, which might be OK, as long as they catch nonoverlapping problems, and don’t have big differences in sensitivity as well. (The original article may have more to say about this – I haven’t checked.)
However, I’m pretty sure that I could develop some pathological inputs that would sneak past these rules. By contrast, I’m pretty sure I’d have a hard time sneaking anything past the NIST or Diehard RNG test suites.
If I were designing this from scratch, I’d use machine learning tools more directly – there are lots of tests for distributions, changes, trend breaks, oscillation, etc. that can be used online with a consistent likelihood interpretation and optimal false positive/negative tradeoffs.
Here’s the model:

It’s interesting to read Shewhart’s Economic control of quality of manufactured product. As I recall, he emphasizes that his control limits were selected, not by theoretical considerations that led to a 3-sigma control limit policy, but by choosing what worked in an economic sense–that is, by selecting thresholds at which it was economically beneficial to investigate or ignore variation in process data. I think Don Wheeler cautions that lots of people miss that point.
I’m not familiar with the Nelson Rules; I have seen the Western Electric rules, which sound somewhat similar.
In cleaning up, I ran across an old copy of Nelson’s article. It appears Nelson was documenting a handout printed on stiff paper that he made (for Western Electric?) summarizing the rules from http://www.westernelectric.com/support-statistical-quality-control-handbook.html. So, while the ML app may have called them the Nelson rules, I think they’re just the Western Electric rules.