Election Fraud and Benford’s Law

Statistical tests only make sense when the assumed distribution matches the data-generating process.

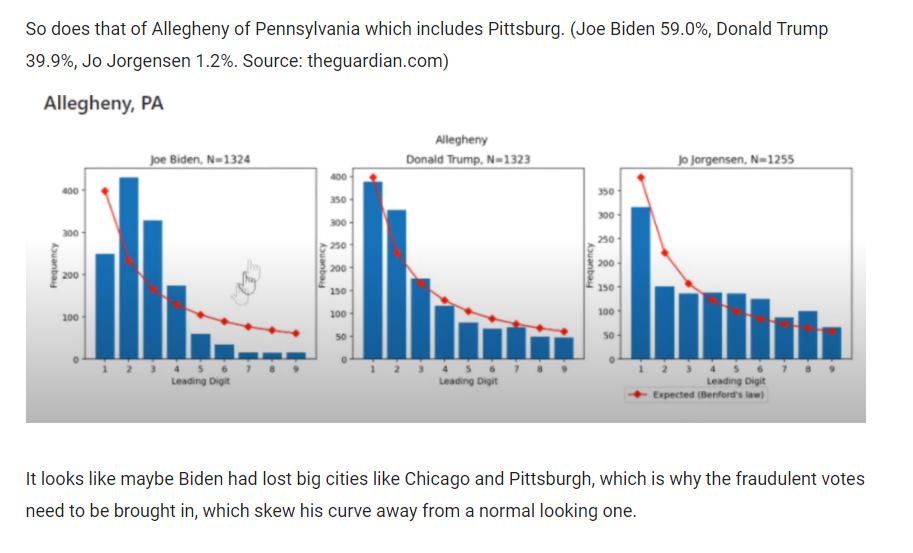
There are several analyses going around that purport to prove election fraud in PA, because the first digits of vote counts don’t conform to Benford’s Law. Here’s the problem: first digits of vote counts aren’t expected to conform to Benford’s Law. So, you might just as well say that election fraud is proved by Newton’s 3rd Law or Godwin’s Law.

Example of bogus conclusions from naive application of Benford’s Law.

Benford’s Law describes the distribution of first digits when the set of numbers evaluated derives from a scale-free or Power Law distribution spanning multiple orders of magnitude. Lots of processes generate numbers like this, including Fibonacci numbers and things that grow exponentially. Social networks and evolutionary processes generate Zipf’s Law, which is Benford-conformant.

Here’s the problem: vote counts may not have this property. Voting district sizes tend to be similar and truncated above (dividing a jurisdiction into equal chunks), and vote proportions tend to be similar due to gerrymandering and other feedback processes. This means the Benford’s Law assumptions are violated, especially for the first digit.

This doesn’t mean the analysis can’t be salvaged. As a check, look at other elections for the same region. Check the confidence bounds on the test, rather than simply plotting the sample against expectations. Examine the 2nd or 3rd digits to minimize truncation bias. Best of all, throw out Benford and directly simulate a distribution of digits based on assumptions that apply to the specific situation. If what you’re reading hasn’t done these things, it’s probably rubbish.

This is really no different from any other data analysis problem. A statistical test is meaningless, unless the assumptions of the test match the phenomena to be tested. You can’t look at lightning strikes the same way you look at coin tosses. You can’t use ANOVA when the samples are non-Normal, or have unequal variances, because it assumes Normality and equivariance. You can’t make a linear fit to a curve, and you can’t ignore dynamics. (Well, you can actually do whatever you want, but don’t propose that the results mean anything.)

Nelson Rules

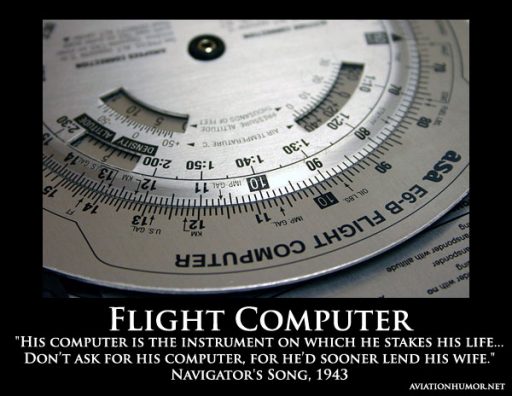
I ran across the Nelson Rules in a machine learning package. These are a set of heuristics for detecting changes in statistical process control. Their inclusion felt a bit like navigating a 787 with a mechanical flight computer (which is a very cool device, by the way).
The idea is pretty simple. You have a time series of measurements, normalized to Z-scores, and therefore varying (most of the time) by plus or minus 3 standard deviations. The Nelson Rules provide a way to detect anomalies: drift, oscillation, high or low variance, etc. Rule 1, for example, is just a threshold for outlier detection: it fires whenever a measurement is more than 3 SD from the mean.

In the machine learning context, it seems strange to me to use these heuristics when more powerful tests are available. This is not unlike the problem of deciding whether a random number generator is really random. It’s fairly easy to determine whether it’s producing a uniform distribution of values, but what about cycles or other long-term patterns? I spent a lot of time working on this when we replaced the RNG in Vensim. Many standard tests are available. They’re not all directly applicable, but the thinking is.

In any case, I got curious how the Nelson rules performed in the real world, so I developed a test model.
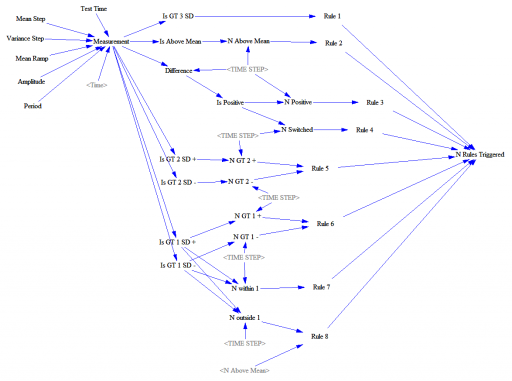
This feeds a test input (Normally distributed random values, with an optional signal superimposed) into a set of accounting variables that track metrics and compare with the rule thresholds. Some of these are complex.

Rule 4, for example, looks for 14 points with alternating differences. That’s a little tricky to track in Vensim, where we’re normally more interested in continuous time. I tackle that with the following structure:

Difference = Measurement-SMOOTH(Measurement,TIME STEP)
**************************************************************
Is Positive=IF THEN ELSE(Difference>0,1,-1)
**************************************************************
N Switched=INTEG(IF THEN ELSE(Is Positive>0 :AND: N Switched<0
,(1-2*N Switched )/TIME STEP
,IF THEN ELSE(Is Positive<0 :AND: N Switched>0
 ,(-1-2*N Switched)/TIME STEP
 ,(Is Positive-N Switched)/TIME STEP)),0)
**************************************************************
Rule 4=IF THEN ELSE(ABS(N Switched)>14,1,0)
**************************************************************

There’s a trick here. To count alternating differences, we need to know (a) the previous count, and (b) whether the previous difference encountered was positive or negative. Above, N Switched stores both pieces of information in a single stock (INTEG). That’s possible because the count is discrete and positive, so we can overload the storage by giving it the sign of the previous difference encountered.

Thus, if the current difference is negative (Is Positive < 0) and the previous difference was positive (N Switched > 0), we (a) invert the sign of the count by subtracting 2*N Switched, and (b) augment the count, here by subtracting 1 to make it more negative.

Similar tricks are used elsewhere in the structure.

How does it perform? Surprisingly well. Here’s what happens when the measurement distribution shifts by one standard deviation halfway through the simulation:
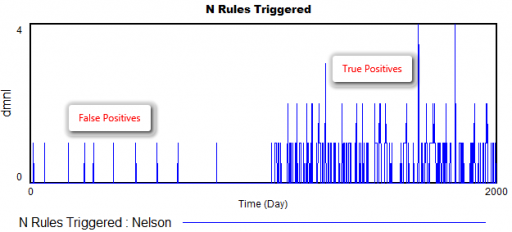
There are a few false positives in the first 1000 days, but after the shift, there are many more detections from multiple rules.

The rules are pretty good at detecting a variety of pathologies: increases or decreases in variance, shifts in the mean, trends, and oscillations. The rules also have different false positive rates, which might be OK, as long as they catch nonoverlapping problems, and don’t have big differences in sensitivity as well. (The original article may have more to say about this – I haven’t checked.)

However, I’m pretty sure that I could develop some pathological inputs that would sneak past these rules. By contrast, I’m pretty sure I’d have a hard time sneaking anything past the NIST or Diehard RNG test suites.

If I were designing this from scratch, I’d use machine learning tools more directly – there are lots of tests for distributions, changes, trend breaks, oscillation, etc. that can be used online with a consistent likelihood interpretation and optimal false positive/negative tradeoffs.

Here’s the model:

NelsonRules1.mdl

NelsonRules1.vpm
False positives, publication bias and systems models

A PLOS Medicine paper asserts that most published results are false.

It can be proven that most claimed research findings are false

Corollary 1: The smaller the studies conducted in a scientific field, the less likely the research findings are to be true.

Corollary 2: The smaller the effect sizes in a scientific field, the less likely the research findings are to be true.

Corollary 3: The greater the number and the lesser the selection of tested relationships in a scientific field, the less likely the research findings are to be true.

Corollary 4: The greater the flexibility in designs, definitions, outcomes, and analytical modes in a scientific field, the less likely the research findings are to be true.

Corollary 5: The greater the financial and other interests and prejudices in a scientific field, the less likely the research findings are to be true.

Corollary 6: The hotter a scientific field (with more scientific teams involved), the less likely the research findings are to be true.

This somewhat alarming result arises from fairly simple statistics of false positives, publication selection bias, and causation vs. correlation problems. While the math is incontrovertible, some of the assumptions have been challenged:

… calculating the unreliability of the medical research literature, in whole or in part, requires more empirical evidence and different inferential models than were used. The claim that “most research findings are false for most research designs and for most fields” must be considered as yet unproven.

Still, the argument seems to be a matter of how much rather than whether publication bias influences findings:

We agree with the paper’s conclusions and recommendations that many medical research findings are less definitive than readers suspect, that P-values are widely misinterpreted, that bias of various forms is widespread, that multiple approaches are needed to prevent the literature from being systematically biased and the need for more data on the prevalence of false claims.

(Others propose similar challenges. There’s conflicting literature about whether (weak) observational studies hold up with (strong) randomized follow-up trials.)

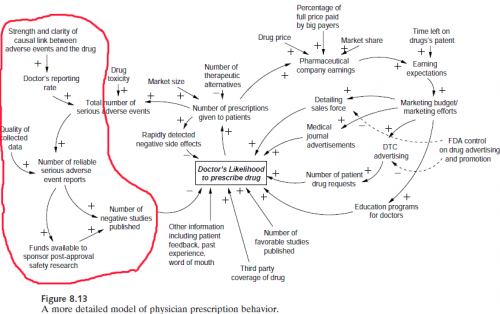
This is obviously a big problem from a control perspective, because the kind of information provided by the studies in question is key to managing many systems, as in Nancy Leveson‘s pharma safety example:

It’s also leads me to a rather pointed self-question. To what extent is typical system dynamics modeling practice subject to the same kinds of biases? Can we say not only that all models are wrong, but that most are useless?

First the good news.

  • SD doesn’t usually operate in the data mining space, where large observational studies seek effects absent any a priori causal theory. That means we’re not operating where false positives are most likely to arise.
  • Often, SD practitioners are not testing our own pet theories, but those of some decision makers – perhaps even theories of competing interests in an organization.
  • SD models play a “knowledge integration” role that’s somewhat analogous to meta-analysis. A meta-analysis pools the statistics from a number of replications of some observation, which improves the signal to noise ratio, making it easier to see whether there’s any baby in the bathwater. An SD model instead pools the effect sizes of inputs (studies or anecdotes) and puts them to a functional test: do the individual components, assembled into a system, yield the observed behavior of the macro system?
  • Similarly, good SD modelers tend to supplement purely statistical inputs with Reality Checks that effectively provide additional data verification by testing extreme conditions where outcomes are known (though this is not helpful if you don’t know anything about relationships to begin with).
  • Including physics (using the term loosely to include things like conservation of people) in models also greatly constrains the space of plausible hypotheses a priori.

Now the bad news.

  • Models are often used in one-off, non-replicable strategic decision making situations, so we’ll never know. Refereed forecasting helps, but success can still be due to luck rather than skill.
  • We often have to formalize soft variable concepts for which definitions are uncertain and measurements are lacking.
  • SD models are often reliant on thin literature bases, small studies, or subject matter expertise to establish relationships. Studies with randomized control are a rarity.
  • Available data for model verification is often of low quality and short duration.
  • Data can provide a weak check on the model – if a system exhibits exponential growth, for example, one positive feedback loop in the dynamic hypothesis is as good as another (though of course good a priori explanations of the structure of the system help).

My suspicion is that savvy modelers are already well aware of just how messy and uncertain their problem domains are. Decisions will be taken, with or without a model, so the real objective is to use the model to add value by rejecting ideas that don’t work. The problem then is not that wrong models make decisions worse, but that we could probably do a lot better if we could be smarter about the possible biases in models and thinking in general.

Alex Tabarrok at Marginal Revolution has a nice take on remedies:

What can be done about these problems? (Some cribbed straight from Ioannidis and some my own suggestions.)

1) In evaluating any study try to take into account the amount of background noise. That is, remember that the more hypotheses which are tested and the less selection which goes into choosing hypotheses the more likely it is that you are looking at noise.

2) Bigger samples are better. (But note that even big samples won’t help to solve the problems of observational studies which is a whole other problem).

3) Small effects are to be distrusted.

4) Multiple sources and types of evidence are desirable.

5) Evaluate literatures not individual papers.

6) Trust empirical papers which test other people’s theories more than empirical papers which test the author’s theory.

7) As an editor or referee, don’t reject papers that fail to reject the null.

For SD modeling, I’d add a few more:

8) Reserve time for exploration of uncertainty (lots of Monte Carlo simulation).

9) Calibrate your confidence bounds.

10) Help clients to appreciate the extent and implications of uncertainty.

11) Pay attention to the language used to describe statistical concepts. Words like “expectation” and “significance” that have specific mathematical interpretations don’t mean the same thing to managers.

11) Look for robust policies that work irrespective of uncertain relationships.

12) Explicitly seek out and test alternative hypotheses (This sounds like it’s at odds with Corollary 3 above, but I think it’s the right thing to do. Testing multiple hypotheses in the context of the model is not the same thing as mining data for multiple relationships.).

13) If you can’t estimate something directly from data, or back it up with literature (more than a single paper), at least articulate some bounds on the effect, perhaps through experiments with a submodel.

What do you think? When is modeling and statistical analysis helpful, and when is it risky business?


Bathtub Statistics

The pitfalls of pattern matching don’t just apply to intuitive comparisons of the behavior of associated stocks and flows. They also apply to statistics. This means, for example, that a linear regression like

stock = a + b*flow + c*time + error

is likely to go seriously wrong. That doesn’t stop such things from sneaking into the peer reviewed literature though. A more common quasi-statistical error is to take two things that might be related, measure their linear trends, and declare the relationship falsified if the trends don’t match. This bogus reasoning remains a popular pastime of climate skeptics, who ask, how could temperature go down during some period when emissions went up? (See this example.) This kind of naive naive statistical reasoning, with static mental models of dynamic phenomena, is hardly limited to climate skeptics though.

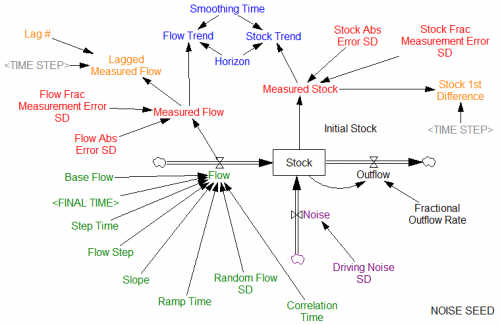
Given the dynamics, it’s actually quite easy to see how such things can occur. Here’s a more complete example of a realistic situation:

At the core, we have the same flow driving a stock. The flow is determined by a variety of test inputs , so we’re still not worrying about circular causality between the stock and flow. There is potentially feedback from the stock to an outflow, though this is not active by default. The stock is also subject to other random influences, with a standard deviation given by Driving Noise SD. We can’t necessarily observe the stock and flow directly; our observations are subject to measurement error. For purposes that will become evident momentarily, we might perform some simple manipulations of our measurements, like lagging and differencing. We can also measure trends of the stock and flow. Note that this still simplifies reality a bit, in that the flow measurement is instantaneous, rather than requiring its own integration process as physics demands. There are no complications like missing data or unequal measurement intervals.

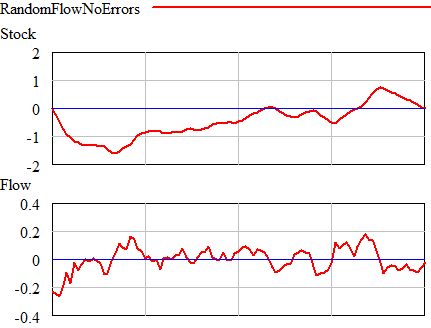
Now for an experiment. First, suppose that the flow is random (pink noise) and there are no measurement errors, driving noise, or outflows. In that case, you see this:

Once could actually draw some superstitious conclusions about the stock and flow time series above by breaking them into apparent episodes, but that’s quite likely to mislead unless you’re thinking explicitly about the bathtub. Looking at a stock-flow scatter plot, it appears that there is no relationship:
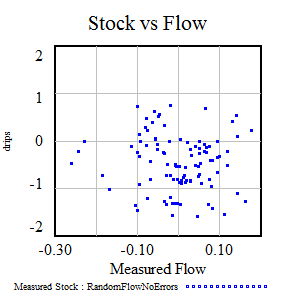
Of course, we know this is wrong because we built the model with perfect Flow->Stock causality. The usual statistical trick to reveal the relationship is to undo the integration by taking the first difference of the stock data. When you do that, plotting the change in the stock vs. the flow (lagged one period to account for the differencing), the relationship reappears: Continue reading “Bathtub Statistics”

Theil Statistics

Source: Created by Rogelio Oliva, 1995; Updated by Tom Fiddaman, 2009 2011 – slight improvement to numerical robustness.

See Sterman, J. D. 1984. Appropriate Summary Statistics for Evaluating the Historical Fit of System Dynamics Models. Dynamica 10 (2): 51-66.

Units balance: Yes

Format: Vensim; requires an advanced version

Files:

D-4584 Theil Statistics documentation– D-memo documentation

Theil_2011.mdl – Theil Statistics model

Theil_2011.vpm – published binary version; includes data.vdf so it’ll run right out of the box

Dummy_data.mdl – dummy data generator creating input to Theil model

Statistics >> Calculus ?

Another TED talk argues for replacing calculus with statistics at the pinnacle of mathematics education.

There’s an interesting discussion at Wild About Math!.

I’m a bit wary of the idea. First, I don’t think there needs to be a pinnacle – math can be a Bactrian camel. Second, some of the concepts are commingled anyway (limits and convergence, for example), so it hardly makes sense to treat them as competitors. Third, both are hugely important to good decision making (which is ultimately what we want out of education). Fourth, the world is a dynamic, stochastic system, so you need to understand a little of each.

Where the real opportunity lies, I think, is in motivating the teaching of both experientially. Start calculus with stocks and flows and physical systems, and start statistics with games of chance and estimation. Use both to help people learn how to make better inferences about a complex world. Then do the math as it gets interesting and necessary. Whether you come at the problem from the angle of dynamics or uncertainty first hardly matters.