
An integrated market model is a hungry beast. It wants data from a variety of areas of a firm’s business, often from a variety of sources. As I said in my previous post, typically these data streams have never been considered together before, and therefore they’re full of contradictions and quality issues. Here’s a real world example, from the pharma business. The details are proprietary, and I’ve stylized the data, but the story is pretty simple.
Suppose you have a product with two different indications. One is short term (for injuries, a 4 month treatment), and one is long term (for a chronic condition, over 24 months). It’s of obvious interest to understand the two markets individually, to enable allocation of resources to distinct marketing efforts for each set of doctors and patients.
Here’s the structure of the market:

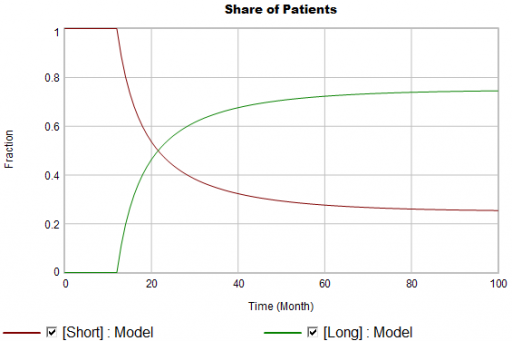
New patients are started on therapy. They remain in the stock of Patients for some time, before they drop out of therapy or switch to another drug. Initially, just the short term indication is approved; the long term indication gets approved a year into the simulation:
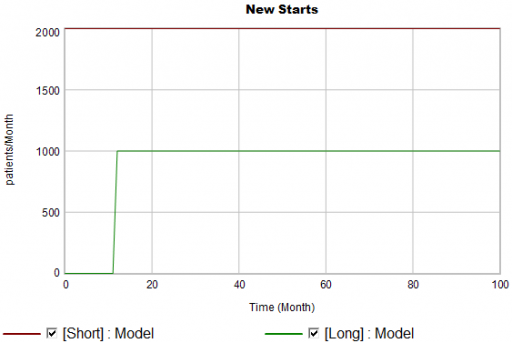
There are twice as many short term starts, but the long term patients stick around 6 times as long, so ultimately there are a lot more of them:
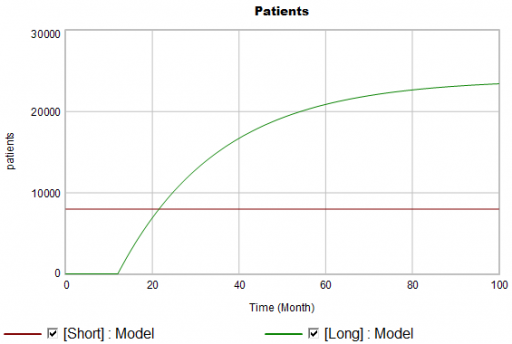
Notice that this is simple first-order goal seeking behavior. The long term patient population is rising toward an equilibrium of (1000 patients/month)x(24 months persistence)=24,000 patients, over a time scale of 24 months.
Puzzle #1
Suppose the data for the long term patients is doing something different (note that the colors now refer to model and data):
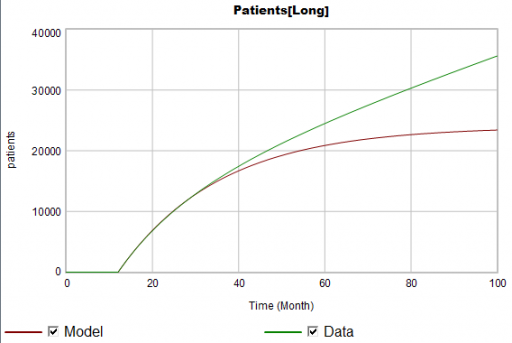
The model is goal-seeking, but the patient population data keeps rising. Bathtub dynamics says that it’s impossible for the step in the inflow of starts to integrate to this pattern when the outflow of dropouts is first order. You’d have to conclude that the model can’t fit the data, without invoking some additional assumptions. For example, the persistence of the long term patients might be increasing as doctors gain experience or the composition of the patient population changes.
But what if I told you that the driving data, new starts, isn’t a “real” measurement? First, new prescriptions aren’t easy to distinguish from refills, and there’s a certain amount of overcounting when patients switch pharmacies or otherwise drop out of the data, then reappear. Second, the short term and long term patients take the same drug, and prescription records don’t say why. So, the data vendor infers the split from dosages, prescriber specialties, and the phase of the moon. The inference happens in an undocumented black box algorithm and there’s no way to establish the ground truth of its performance.
Now, do you trust the algorithm, or doctors who say they know the duration of treatment – but might be missing something too?
Puzzle #2
Even in the presence of algorithmic uncertainty, you’d expect certain dynamic reality checks to pass. Consider the share of long term patients in the market. For new starts, it’s a step function, rising from 0 to 1/3 at launch in month 12:
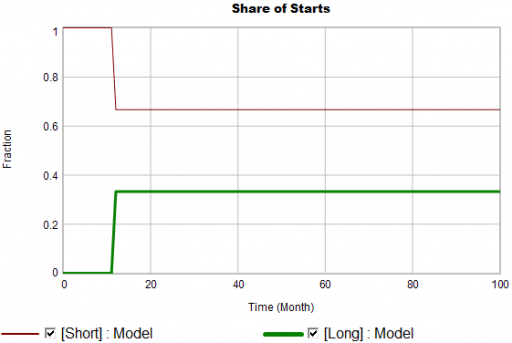
Again, from the bathtub, we know that the patient population can’t instantly mimic the step in starts. If the system is first order with constant persistence, the long term share of patients should rise gradually to 3/4 (1000*24/(1000*24+2000*4)). If persistence is increasing, per puzzle #1, it might go higher on a longer time scale, but it can’t go faster.
Now, suppose the data does something unexpected:
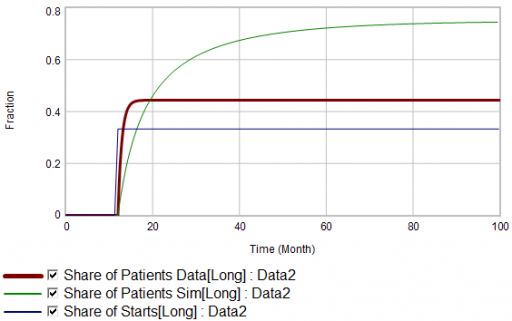
Here, the patient population share data mimics the share of new starts with a time constant that’s very short compared to the persistence of therapy. This should be dynamically impossible in a simple system. But, as always, you could start invoking time varying inputs or parameters to explain what the data shows. (And remember that the real data is noisy, making it harder to be sure about anything.)
But I think there’s another, simpler explanation. The data vendor could be using the same or similar algorithms to classify new starts and existing patients. It could be wrong about the inflow split, or wrong about the stocks, or both. And, it could be reclassifying existing patients from short to long and back with a time constant much faster than the persistence of therapy permits.
Conclusion
It turns out that, in spite of having lots of data about this system, we don’t actually know much. This is a problem for model calibration, because we don’t know which source to trust. Uncertainty in the calibration propagates into decision making. It’s awkward for people in the firm to revise the stories they’ve used to justify past actions. It ought to be awkward for the data vendor to provide flaky information, but luckily they have a near-monopoly.
But we still have options:
- Track down the data issues. This is the most attractive idea in principle, but it might be slow and expensive to find someone at the data vendor who knows what’s going on, and even then the answer might be unsatisfactory.
- Model the data. If some details of the data collection process are known, it’s often possible to reverse engineer the “real” data from flawed measurements.
- Split the difference. Calibrate as best you can to all available information, including gut feel and known “physics” of the situation, not just the numerical data.
- Embrace the uncertainty. If no theory fits the data, look for policies that are robust to alternative futures, and convey the irreducible uncertainty of the situation to decision makers.
A real challenge for modelers is that model consumers typically have science tastes on a propaganda budget. People are used to seeing data that looks precise, full of enticing detail, with conclusions that sound plausible, but are little more than superstition. It’s cheap to make nice graphics and long figure-rich Powerpoint decks.
Really sorting out what’s going on in situations like this is hard, but it can have great strategic value. For example, in this case, if persistence is increasing, it’s more critical than ever to win the long term patients. If market shares could differ dramatically from what measurements report, competitive threats and opportunities could go unnoticed. Anyone who can use models to discover the fog of data and see through it will have a real competitive edge.