
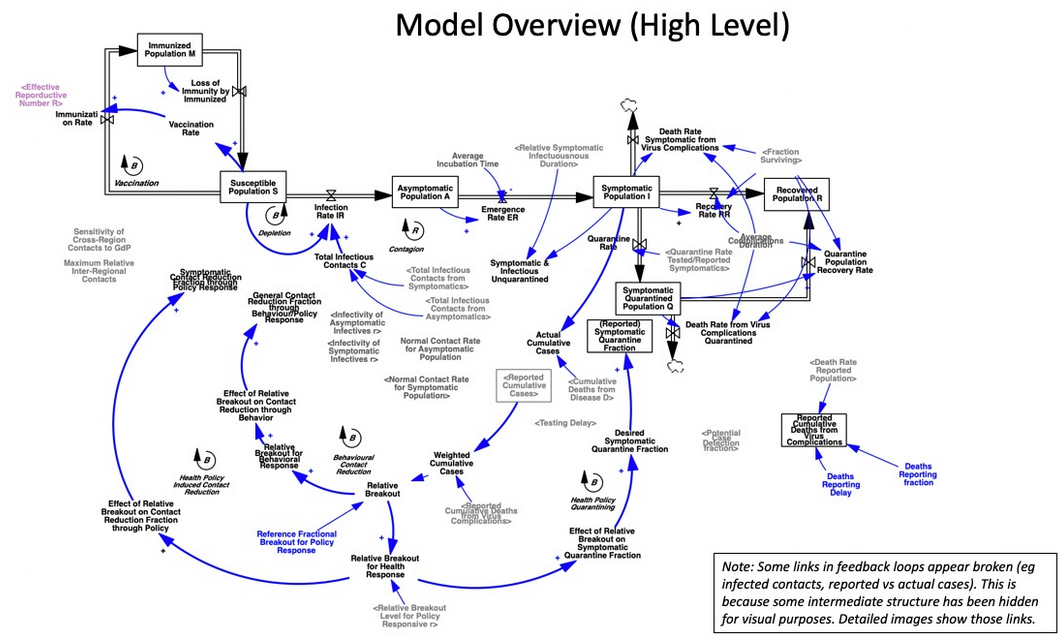
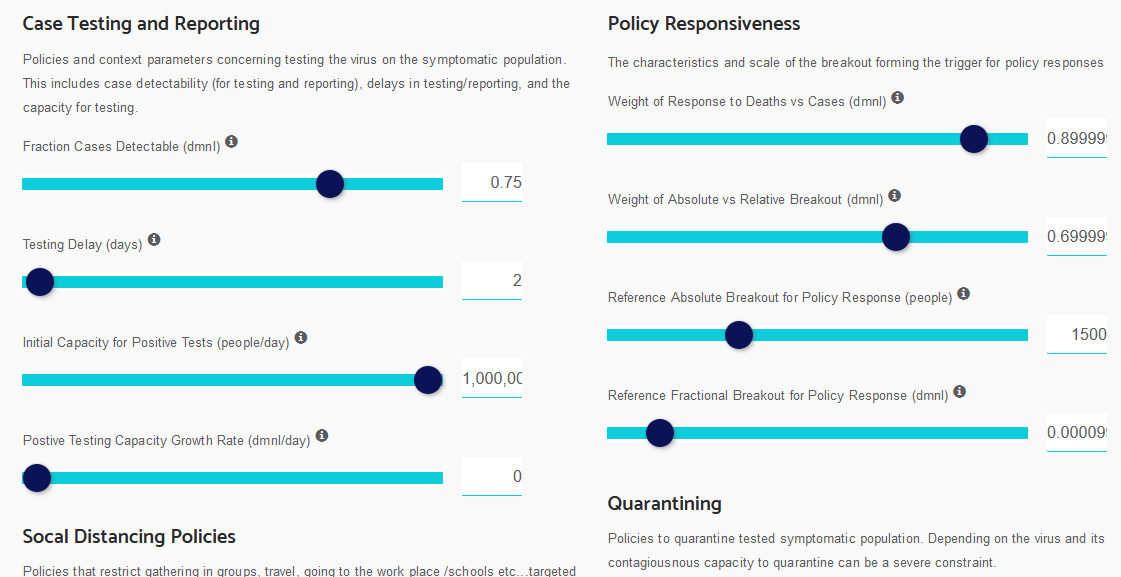
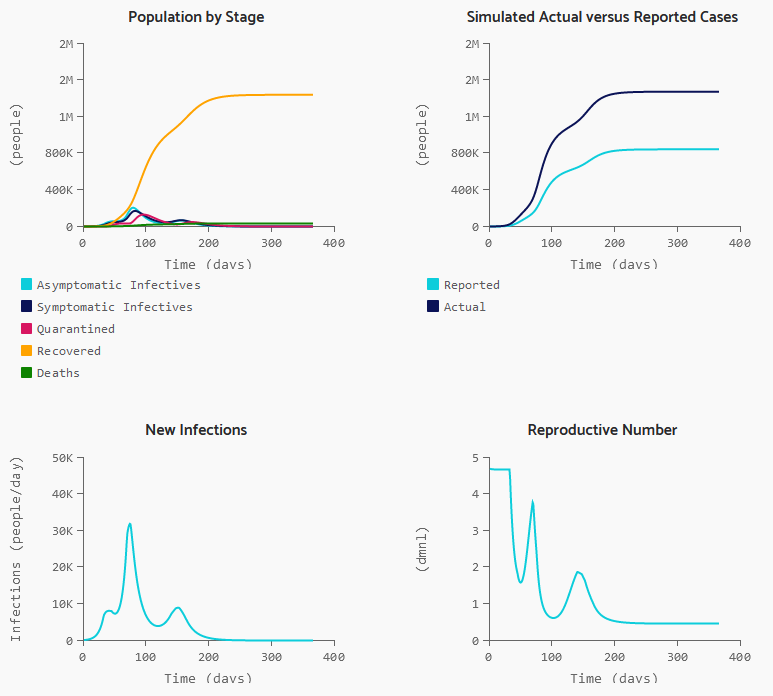
Jeroen Struben has a nice interactive web simulation running online at Forio. It’s multiregion, with diffusion of infection across borders, and includes some of the interesting structures I excluded from my simple model, including explicit quarantine and vaccination, and testing and reporting lags.
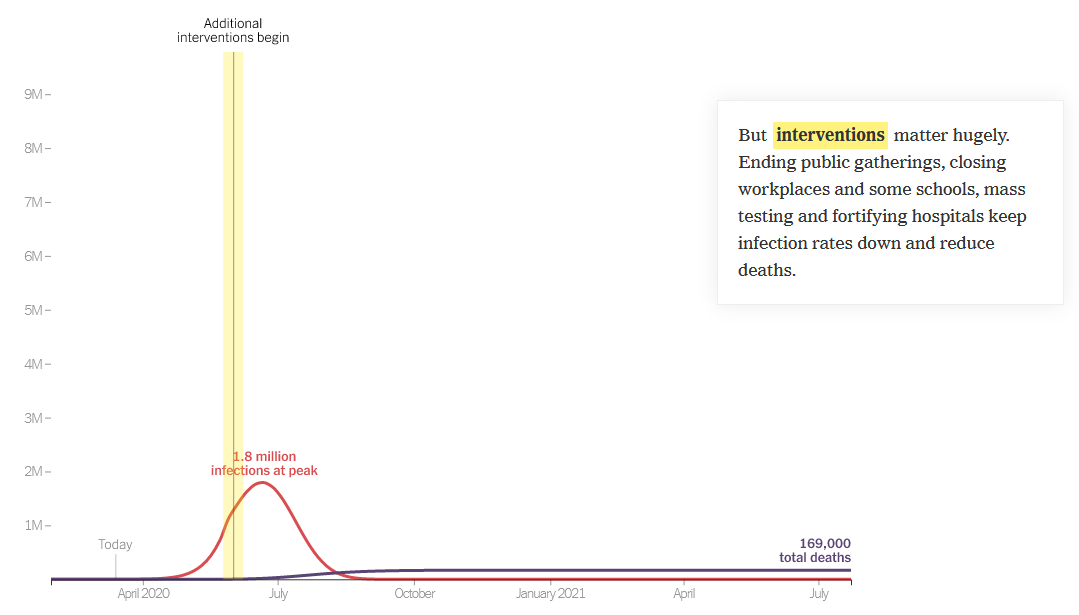
The NYT has a very simple interactive simulation embedded in:
How Much Worse the
Coronavirus Could Get, in Charts
As always, I’m eager to know of more – please comment!
Two more:
Modeling COVID-19 Spread vs Healthcare Capacity
https://alhill.shinyapps.io/COVID19seir/
Pandemic Preparedness Planning for COVID-19
http://covidsim.eu/
Very cool! But will/can the model actually slow or contain spread of the virus? The CDC earlier this week reported some ominous worst-case scenarios for the US. Africa, once the only unaffected continent, now has 19 of 54 countries reporting at least one case. What does the model suggest that Africa must do today to avoid becoming the next China, Europe and/or the US? What are the model’s assumptions? Vaccines are mentioned as an input but we’re 6-12 months away from having one, let alone one that is ready for mass distribution.
There’s no vaccine in the model, though that could be added fairly quickly (others have certainly done so). I limited the horizon to a year, with the idea that (optimistically) a vaccine might be available at that point. My focus however was on getting through the next couple of months.
Africa, India etc. definitely have daunting challenges. I haven’t really thought about it, but presumably treatment and contact tracing capacity are very limited. On the other hand, their populations are younger, which is a big advantage.
Could the ‘perceived infection rate’ be important here? The public often may set ‘perceived infection rate’ as equal to ‘reported infection rate’ while experts, by definition, see it as much lower. The public’s ‘perceived infection rate’ seems to impact the ‘contact rate’ in the SIR model.
How much difference does it make what different sets of stakeholders think? If the public or national leaders take too long to begin to trust experts, what difference does that make for the trajectory of infections?
So far, some of the media coverage, (e.g., of the outbreak in Iran, and to some extent on the US) has focused on this issue. Are the members of the media emphasizing the wrong things?
Woops: experts (who still can’t know the ‘actual infection rate’ in real time) set ‘perceived infection rate’ as much higher than ‘reported infection rate’, not much lower.
I agree that this is important. It also relates to the question of whether lots of mild cases will save us (which I very much doubt).
There is a more interactive New York Times model at the bottom of this opinion piece:
https://www.nytimes.com/interactive/2020/03/25/opinion/coronavirus-trump-reopen-america.html?fbclid=IwAR3jifGQrCKTEc3ReE9BTVrD_PnAN-ObSG6V0PwUXGB5fQUU2HVV7E4H9rE
There are several concerns I have about variables that you cannot adjust. I would like to be able adjust the incubation time, the 5 days may be too short but it would be interesting to see how it affects the curve. The infectious period of 2.9 days seems very short to me. I am afraid that varying these would make the projections scarier than they already are.
Cool – I haven’t had a chance to digest this but will comment.
I think the 2.9 day infectious period relates to my most recent post on steady state growth. Basically, either the infectious period is short or the reproduction ratio R0 is terrifyingly high.
Thanks.
I appreciate you looking at this. I am a retired family practice doctor with 3 years of graduate work in physiology, most of your site is way over my head. I am concerned about some of the numbers being thrown out there, like this NY Times article. If I change the time of interventions to 60 days and increase the Ro to 3.3, as in your model, it makes it look like the interventions in their model are almost useless. I would be very interested to hear what you think of their model in general.
Thanks
I can’t see enough of the innards of the model to be sure, but it feels pretty reasonable. A high r0 is definitely extremely problematic, especially for the US where there’s no federal leadership and a lot of variability in state policy. States that have successful interventions on their own will be bombarded by the infected from failed states. Unfortunately, I think you are right to be concerned. On the other hand, I still think we can solve this. It would be a lot easier if the idiots at the top got out of the way.
Here is another SEIR model that is on some state websites:
https://covidactnow.org
I would really appreciate the opinion of any of you that post here on the CovidActNow model I mentioned about. I hadn’t really looked at it closely until last night and the implications are very alarming. On all of the states and counties I looked at, they show a larger “wave” following what we have experienced so far that will become evident soon and not peak until late May/early July. I looked through the assumptions they are using (you can get to them through the FAQ or at the bottom of the graphs) and cannot see anything I could argue with. I realize that I am out of place on a systems dynamics site but I don’t know anywhere else I can find your expertise.
I’m not a fan. I haven’t looked at it for a while, but I think the discrete time implementation, with a long time step, is not a good idea. Maybe they’ve improved it.
Another SEIR, this one from Harvard
https://science.sciencemag.org/content/early/2020/04/14/science.abb5793