
This is a follow-on to The Normal distribution is a bad COVID19 model.
I understand that the IHME model is now more or less the official tool of the Federal Government. Normally I’m happy to see models guiding policy. It’s better than the alternative: would you fly in a plane designed by lawyers? (Apparently we have been.)
However, there’s nothing magic about a model. Using flawed methods, bad data, the wrong boundary, etc. can make the results GIGO. When a bad model blows up, the consequences can be just as harmful as any other bad reasoning. In addition, the metaphorical shrapnel hits the rest of us modelers. Currently, I’m hiding in my foxhole.
On top of the issues I mentioned previously, I think there are two more problems with the IHME model:
First, they fit the Normal distribution to cumulative cases, rather than incremental cases. Even in a parallel universe where the nonphysical curve fit was optimal, this would lead to understatement of the uncertainty in the projections.
Second, because the model has no operational mapping of real-world concepts to equation structure, you have no hooks to use to inject policy changes and the uncertainty associated with them. You have to construct some kind of arbitrary index and translate that to changes in the size and timing of the peak in an unprincipled way. This defeats the purpose of having a model.
For example, from the methods paper:
A covariate of days with expected exponential growth in the cumulative death rate was created using information on the number of days after the death rate exceeded 0.31 per million to the day when different social distancing measures were mandated by local and national government: school closures, non-essential business closures including bars and restaurants, stay-at-home recommendations, and travel restrictions including public transport closures. Days with 1 measure were counted as 0.67 equivalents, days with 2 measures as 0.334 equivalents and with 3 or 4 measures as 0.
This postulates a relationship that has only the most notional grounding. There’s no concept of compliance, nor any sense of the effect of stringency and exceptions.
In the real world, there’s also no linear relationship between “# policies implemented” and “days of exponential growth.” In fact, I would expect this to be extremely nonlinear, with a threshold effect. Either your policies reduce R0 below 1 and the epidemic peaks and shrinks, or they don’t, and it continues to grow at some positive rate until a large part of the population is infected. I don’t think this structure captures that reality at all.
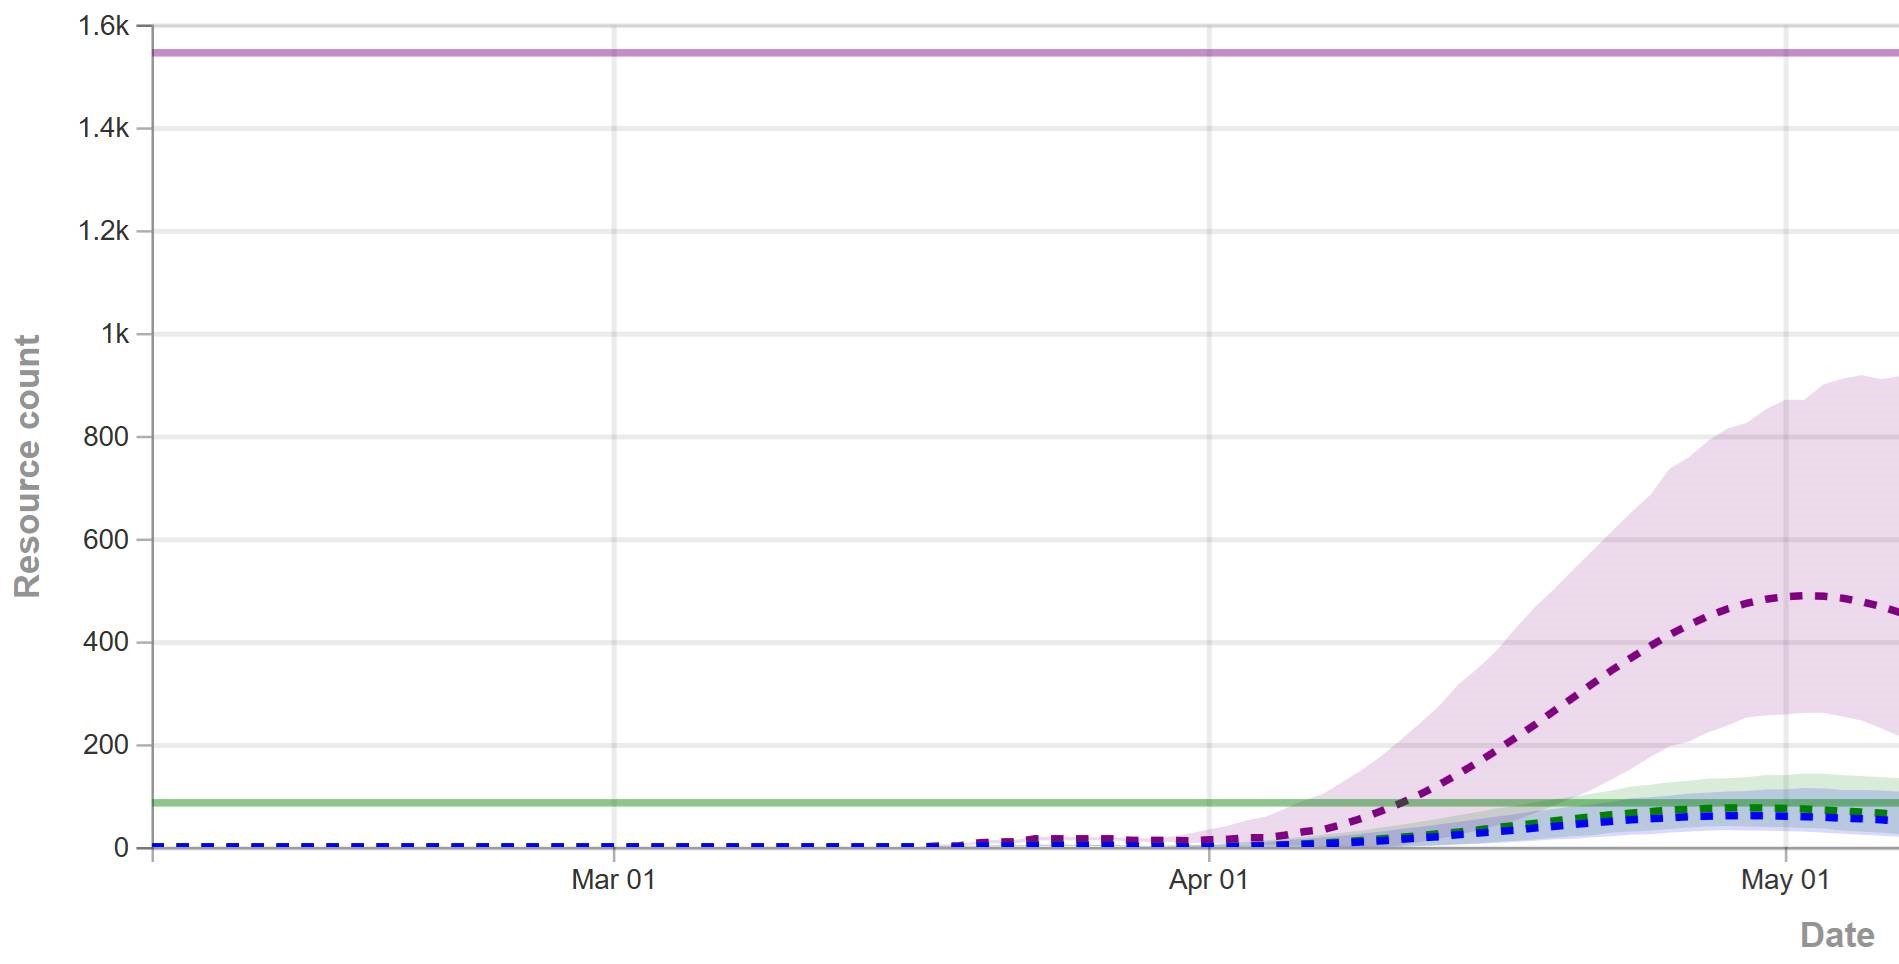
That’s why, in the IHME figure above (retrieved yesterday), you don’t see any scenarios in which the epidemic fizzles, because we get lucky and warm weather slows the virus, or there are many more mild cases than we thought. You also don’t see any runaway scenarios in which measures fail to bring R0 below 1, resulting in sustained growth. Nor is there any possibility of ending measures too soon, resulting in an echo.
For comparison, I ran some sensitivity runs my model for North Dakota last night. I included uncertainty from fit to data (for example, R0 constrained to fit observations via MCMC) and some a priori uncertainty about effectiveness and duration of measures, and from the literature about fatality rates, seasonality, and unobserved asymptomatics.
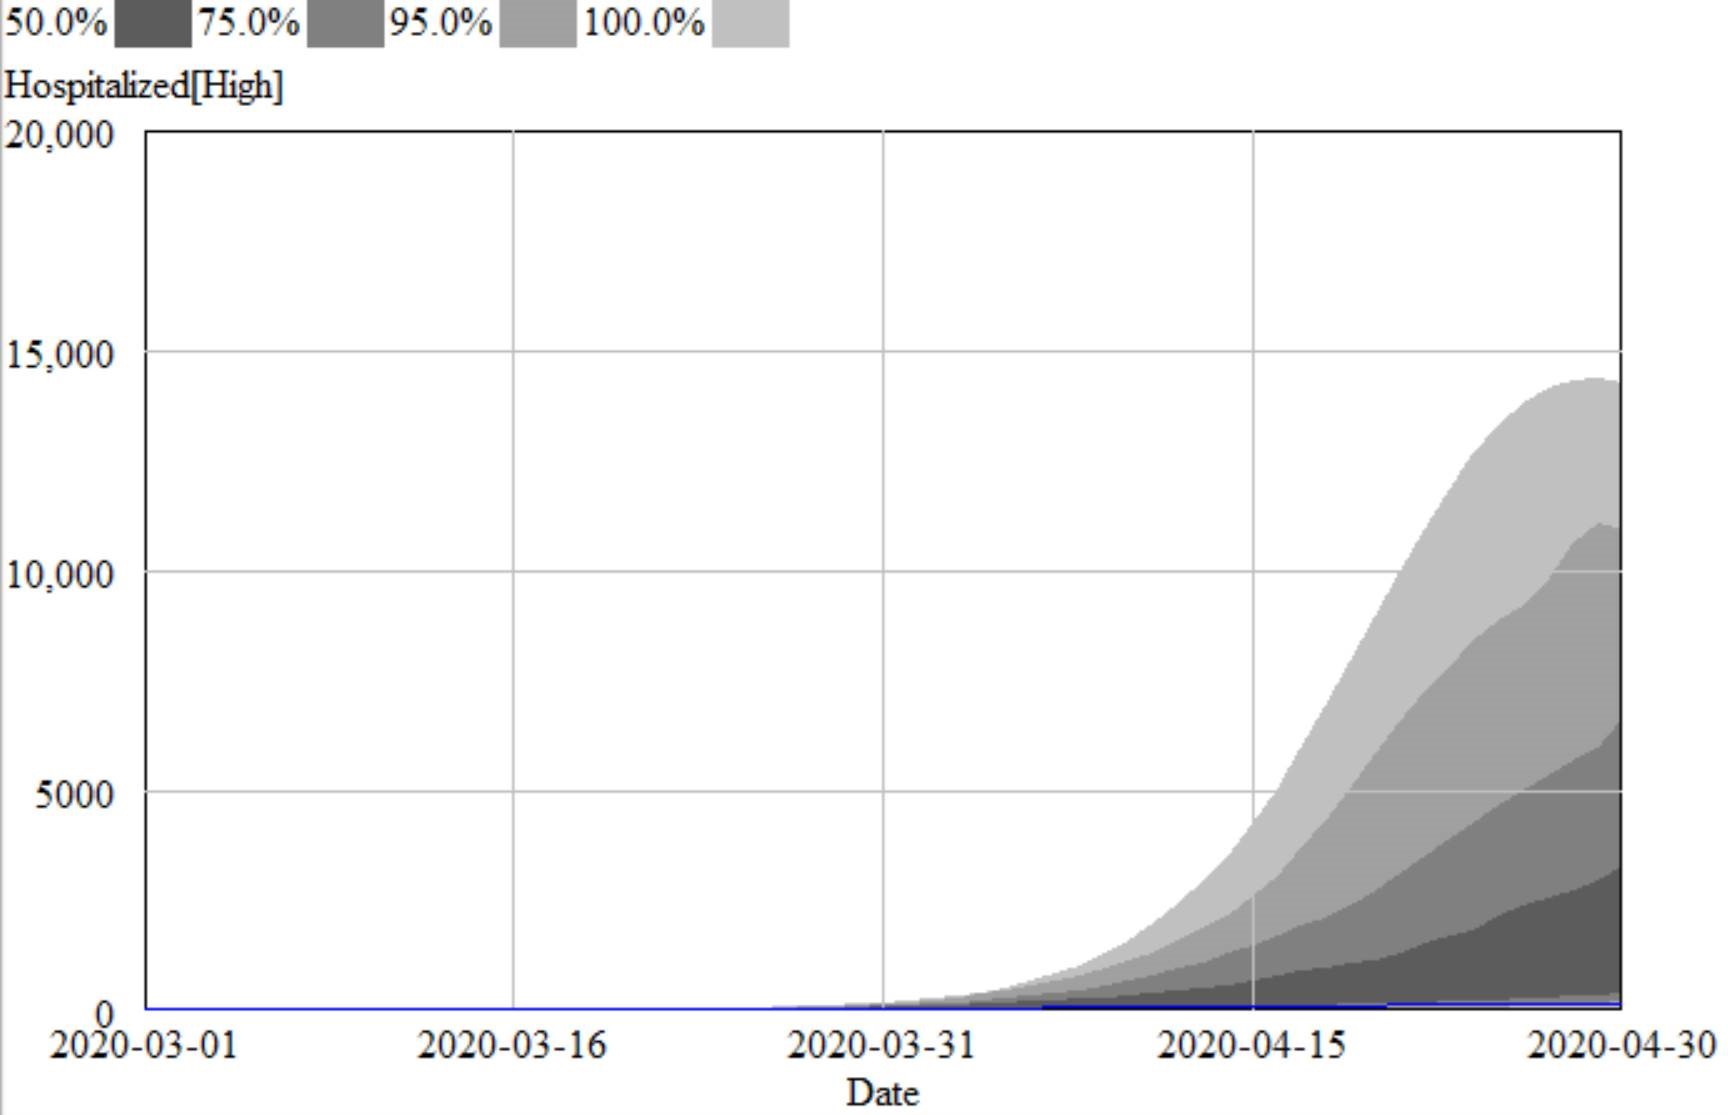
I found that I couldn’t exclude the IHME projections from my confidence bounds, so they’re not completely crazy. However, they understate the uncertainty in the situation by a huge margin. They forecast the peak at a fairly definite time, plus or minus a factor of two. With my hybrid-SEIR model, the 95% bounds include variation by a factor of 10. The difference is that their bounds are derived only from curve fitting, and therefore omit a vast amount of structural uncertainty that is represented in my model.
Who is right? We could argue, but since the IHME model is statistically flawed and doesn’t include any direct effect of uncertainty in R0, prevalence of unobserved mild cases, temperature sensitivity of the virus, effectiveness of measures, compliance, travel, etc., I would not put any money on the future remaining within their confidence bounds.
Thanks, Tom, putting on these sharp questions and questioning on the models used by the officials in the policy rounds. I wonder whether it will be possible to initiate a fruitful conversation with the modelers of the IHME method, to improve public and policy maker understanding of the complex dynamics at play with the virus itself and the pandemics.
Seems to me that too often such models are grounded in numbers leaving out real-life behaviors and observations, as well as assumptions about human behavior.
Sidenote: I have to mention that back in the day while studying economics I got interested in econometrics. Soon enough it was clear that “number crunching” was the main thing, but little practical real-world implications and policies. So I backed off.
I have seen this IHME model referred to more times than I am comfortable with. I have been monitoring the number of new cases per day in several countries and states in the US. I have noticed several times that the the numbers appear to follow a standard curve but deviate when the cases starts to even off or decline, they will then increase again to another peak and decline. I suspect this is when another outbreak occurs within the same country or state. Using a bell shaped curve for a single outbreak may work but not for a country with multiple outbreaks that are separated by time.
Carl Bergstrom, Professor at U of Washington, has had some interesting commentary on IHME and Imperial College models. Here is his latest thread
https://twitter.com/CT_Bergstrom/status/1246957709682806785?s=20
I am disturbed by the fact that all IHME models have scenarios that end rather quickly… with deaths going to zero. I can find no scenarios in my own (limited) model that do this, and it seems rather unlikely that relaxing social distancing will be possible without, at a minimum, creating a very long tapering off of cases under ideal conditions with a early start. That is with a compliance with social distancing that weakens as reports of new cases (compared to an arbitrary “worry level”) drop.
With a basic SEIR model placing early restrictions merely pushes an outbreak into the future.
So I am missing something… how are these models managing to make the epidemic disappear so quickly in the future. Is that even remotely realist?