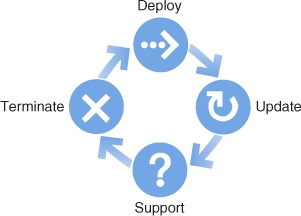
“It’s Time to Retire ‘Crap Circles’,” argues Gardiner Morse in the HBR. I wholeheartedly agree. He’s assembled a lovely collection of examples. Some violate causality amusingly:

“Through some trick of causality, termination leads to deployment.”
Morse ridicules one diagram that actually shows an important process,
The friendly-looking sunburst that follows, captured from the website of a solar energy advocacy group, shows how to create an unlimited market for your product. Here, as the supply of solar energy increases, so does the demand — in an apparently endless cycle. If these folks are right, we’re all in the wrong business.
This is not a particularly well-executed diagram, but the positive feedback process (reinforcing loop) of increasing demand driving economies of scale, lowering costs and further increasing demand, is real. Obviously there are other negative loops that restrain this one from delivering infinite solar, but not every diagram needs to show every loop in a system.
Unfortunately, Morse’s prescription, “We could all benefit from a little more linear thinking,” is nearly as alarming as the illness. The vacuous linear processes are right there next to the cycles in PowerPoint’s Smart Art:

Linear thinking isn’t a get-out-of-chartjunk-free card. It’s an invitation to event-driven unidirectional causal thinking, laundry lists, and George Richardson’s Dead Buffalo Syndrome. What we really need is more understanding of causality and feedback, and more operational thinking, so that people draw meaningful graphics, employing cycles where they appropriately describe causality.
h/t John Sterman for pointing this out.
