Time to short some social network stocks?

I don’t want to wallow too long in metaphors, so here’s something with a few equations.

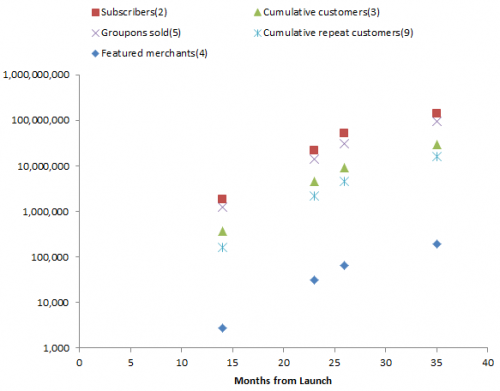
A recent arXiv paper by Peter Cauwels and Didier Sornette examines market projections for Facebook and Groupon, and concludes that they’re wildly overvalued.

We present a novel methodology to determine the fundamental value of firms in the social-networking sector based on two ingredients: (i) revenues and profits are inherently linked to its user basis through a direct channel that has no equivalent in other sectors; (ii) the growth of the number of users can be calibrated with standard logistic growth models and allows for reliable extrapolations of the size of the business at long time horizons. We illustrate the methodology with a detailed analysis of facebook, one of the biggest of the social-media giants. There is a clear signature of a change of regime that occurred in 2010 on the growth of the number of users, from a pure exponential behavior (a paradigm for unlimited growth) to a logistic function with asymptotic plateau (a paradigm for growth in competition). […] According to our methodology, this would imply that facebook would need to increase its profit per user before the IPO by a factor of 3 to 6 in the base case scenario, 2.5 to 5 in the high growth scenario and 1.5 to 3 in the extreme growth scenario in order to meet the current, widespread, high expectations. […]

I’d argue that the basic approach, fitting a logistic to the customer base growth trajectory and multiplying by expected revenue per customer, is actually pretty ancient by modeling standards. (Most system dynamicists will be familiar with corporate growth models based on the mathematically-equivalent Bass diffusion model, for example.) So the surprise for me here is not the method, but that forecasters aren’t using it.

Looking around at some forecasts, it’s hard to say what forecasters are actually doing. There’s lots of handwaving and blather about multipliers, and little revelation of actual assumptions (unlike the paper). It appears to me that a lot of forecasters are counting on big growth in revenue per user, and not really thinking deeply about the user population at all.

To satisfy my curiosity, I grabbed the data out of Cauwels & Sornette, updated it with the latest user count and revenue projection, and repeated the logistic model analysis. A few observations:

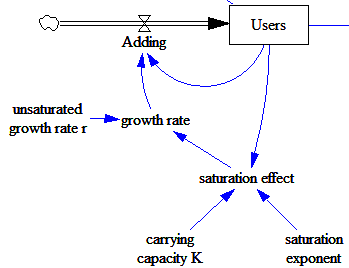
I used a generalized logistic, which has one more parameter, capturing possible nonlinearity in the decline of the growth rate of users with increasing saturation of the market. Here’s the core model:

Continue reading “Time to short some social network stocks?”

Diagramming for thinking

An article in Science asks,

Should science learners be challenged to draw more? Certainly making visualizations is integral to scientific thinking. Scientists do not use words only but rely on diagrams, graphs, videos, photographs, and other images to make discoveries, explain findings, and excite public interest. From the notebooks of Faraday and Maxwell to current professional practices of chemists, scientists imagine new relations, test ideas, and elaborate knowledge through visual representations.

Drawing to Learn in Science, Shaaron Ainsworth, Vaughan Prain, Russell Tytler (this link might not be paywalled)

Continuing,

However, in the science classroom, learners mainly focus on interpreting others’ visualizations; when drawing does occur, it is rare that learners are systematically encouraged to create their own visual forms to develop and show understanding. Drawing includes constructing a line graph from a table of values, sketching cells observed through a microscope, or inventing a way to show a scientific phenomenon (e.g., evaporation). Although interpretation of visualizations and other information is clearly critical to learning, becoming proficient in science also requires learners to develop many representational skills. We suggest five reasons why student drawing should be explicitly recognized alongside writing, reading, and talking as a key element in science education. …

The paper goes on to list a lot of reasons why this is important. Continue reading “Diagramming for thinking”

Models and metaphors

My last post about metaphors ruffled a few feathers. I was a bit surprised, because I thought it was pretty obvious that metaphors, like models, have their limits.

The title was just a riff on the old George Box quote, “all models are wrong, some are useful.” People LOVE to throw that around. I once attended an annoying meeting where one person said it at least half a dozen times in the space of two hours. I heard it in three separate sessions at STIA (which was fine).

I get nervous when I hear, in close succession, about the limits of formal mathematical models and the glorious attributes of metaphors. Sure, a metaphor (using the term loosely, to include similes and analogies) can be an efficient vehicle for conveying meaning, and might lend itself to serving as an icon in some kind of visualization. But there are several possible failure modes:

  • The mapping of the metaphor from its literal domain to the concept of interest may be faulty (a bathtub vs. a true exponential decay process).
  • The point of the mapping may be missed. (If I compare my organization to the Three Little Pigs, does that mean I’ve built a house of brick, or that there are a lot of wolves out there, or we’re pigs, or … ?)
  • Listeners may get the point, but draw unintended policy conclusions. (Do black swans mean I’m not responsible for disasters, or that I should have been more prepared for outliers?)

These are not all that different from problems with models, which shouldn’t really come as a surprise, because a model is just a special kind of metaphor – a mapping from an abstract domain (a set of equations) to a situation of interest – and neither a model nor a metaphor is the real system.

Models and other metaphors have distinct strengths and weaknesses though. Metaphors are efficient, cheap, and speak to people in natural language. They can nicely combine system structure and behavior. But that comes at a price of ambiguity. A formal model is unambiguous, and therefore easy to test, but potentially expensive to build and difficult to share with people who don’t speak math. The specificity of a model is powerful, but also opens up opportunities for completely missing the point (e.g., building a great model of the physics of a situation when the crux of the problem is actually emotional).

I’m particularly interested in models for their unique ability to generate reliable predictions about behavior from structure and to facilitate comparison with data (using the term broadly, to include more than just the tiny subset of reality that’s available in time series). For example, if I argue that the number of facebook accounts grows logistically, according to dx/dt=r*x*(k-x) for a certain r, k and x(0), we can agree on exactly what that means. Even better, we can estimate r and k from data, and then check later to verify that the model was correct. Try that with “all the world’s a stage.”

If you only have metaphors, you have to be content with not solving a certain class of problems. Consider climate change. I say it’s a bathtub, you say it’s a Random Walk Down Wall Street. To some extent, each is true, and each is false. But there’s simply no way to establish which processes dominate accumulation of heat and endogenous variability, or to predict the outcome of an experiment like doubling CO2, by verbal or visual analogy. It’s essential to introduce some math and data.

Models alone won’t solve our problems either, because they don’t speak to enough people, and we don’t have models for the full range of human concerns. However, I’d argue that we’re already drowning in metaphors, including useless ones (like “the war on [insert favorite topic]”), and in dire need of models and model literacy to tackle our thornier problems.

Not feelin' so Groovy any more

We used to rely on Groove for coordination of a lot of company projects. It was originally an “insanely great” product, with a lot of advantages over web-based alternatives like Central Desktop. Then Microsoft bought it. It’s been downhill since then. Here’s the MS evil plan for the destruction of Groove, as it has unfolded:

1. Make upgrades a hostile account takeover, with limited backwards compatibility.

2. Eliminate essential features, like export of message history to a discussion.

3. Make the product difficult to obtain, reducing its viral appeal, by eliminating trial accounts, hiding old versions, and providing bloated bundles.

4. License per PC rather than per user, to make use for sync uneconomic.

5. Change the name to maximize confusion with regular Sharepoint, which is fundamentally different (server-centric vs. P2P).

Update

6. Break folder sharing on 64bit OS flavors (it worked fine in Groove 3.1)

I have a hard time thinking of an objective function that makes this rational. My guess is that the existing Sharepoint group within MS felt threatened and had the political power to mess up Groove, but not quite enough to kill it outright. This reinforces my suspicion that companies are engines of capitalism on the outside, but inefficient centrally-planned economies on the inside, so we’d be better off if they weren’t so big.

Anyone know a good P2P alternative? Or at least a server-based tool that works well offline? All I really want is integrated  file sharing, instant messaging, and discussion, with good security and easy drag-&-drop to the desktop.

Systems thinking & asymmetric information

At the STIA conference I played Forio’s Everest simulation, a multiplayer teamwork/leadership game, widely used in business schools.

Our team put 2 on the summit and 2 in the hospital. In the game, the unlucky climbers were rescued by helicopter, though in reality they might have ended up in the morgue as the current helicopter rescue record stands at 19,833 feet – far short of the high camps on Everest.

– Pavel Novak, Wikimedia Commons, CC Attribution Share-Alike 2.5 Generic

As the game progressed, I got itchy – where were the dynamics? Oscillations in the sherpa supply chain? Maybe a boom and bust of team performance? Certainly there were some dynamics, related to irreversible decisions to ascend and descend, but counterintuitive behavior over time was not really the focus of the game.

Instead, it was about pathologies of information sharing on teams. It turns out that several of our near-fatal incidents hinged on information held by a single team member. Just on the basis of probability, unique information is less likely to come up in team deliberations. But it turns out that this is reinforced by reinforcement bias that favors processing of shared information, to the detriment of team performance when unique information is important. While I’d still be interested to ponder the implications of this in a dynamic setting, I found this insight valuable for its own sake.

Back in the old days there was an undercurrent of debate about whether systems thinking was a subset of system dynamics, or vice versa. While I’d like SD to be the one method to rule them all, I have to admit that there’s more to systems than dynamics. There are a lot of interesting things going on at the intersection of multiple stakeholder interests, information and mental models, even before things start evolving over time. We grapple with these issues in practically every SD engagement, but they’re not our core focus, so it’s always nice to have a little cross-fertilization.

All metaphors are wrong – some are useful

I’m hanging out at the Systems Thinking in Action conference, which has been terrific so far.

The use of metaphors came up today. A good metaphor can be a powerful tool in group decision making. It can wrap a story about structure and behavior into a little icon that’s easy to share and relate to other concepts.

But with that power comes a bit of danger, because, like models, metaphors have limits, and those limits aren’t always explicit or shared. Even the humble bathtub can be misleading. We often use bathtubs as analogies for first-order exponential decay processes, but real bathtubs have a nonlinear outflow, so they actually decay linearly. (Update: that is, the water level as a function of time falls linearly, assuming the tub has straight sides, because the rate of outflow varies with the square root of the level.)

Apart from simple caution, I think the best solution to this problem when stakes are high is to formalize and simulate systems, because that process forces you to expose and challenge many assumptions that otherwise remain hidden.

Linear regression bathtub FAIL

I seldom run across an example of so many things that can go wrong with linear regression in one place, but one just crossed my reader.

A new paper examines the relationship between CO2 concentration and flooding in the US, and finds no significant impact:

Has the magnitude of floods across the USA changed with global CO2 levels?

R. M. Hirsch & K. R. Ryberg

Abstract

Statistical relationships between annual floods at 200 long-term (85–127 years of record) streamgauges in the coterminous United States and the global mean carbon dioxide concentration (GMCO2) record are explored. The streamgauge locations are limited to those with little or no regulation or urban development. The coterminous US is divided into four large regions and stationary bootstrapping is used to evaluate if the patterns of these statistical associations are significantly different from what would be expected under the null hypothesis that flood magnitudes are independent of GMCO2. In none of the four regions defined in this study is there strong statistical evidence for flood magnitudes increasing with increasing GMCO2. One region, the southwest, showed a statistically significant negative relationship between GMCO2 and flood magnitudes. The statistical methods applied compensate both for the inter-site correlation of flood magnitudes and the shorter-term (up to a few decades) serial correlation of floods.

There are several serious problems here.

First, it ignores bathtub dynamics. The authors describe causality from CO2 -> energy balance -> temperature & precipitation -> flooding. But they regress:

ln(peak streamflow) = beta0 + beta1 × global mean CO2 + error

That alone is a fatal gaffe, because temperature and precipitation depend on the integration of the global energy balance. Integration renders simple pattern matching of cause and effect invalid. For example, if A influences B, with B as the integral of A, and A grows linearly with time, B will grow quadratically with time. The situation is actually worse than that for climate, because the system is not first order; you need at least a second-order model to do a decent job of approximating the global dynamics, and much higher order models to even think about simulating regional effects. At the very least, the authors might have explored the usual approach of taking first differences to undo the integration, though it seems likely that the data are too noisy for this to reveal much.

Second, it ignores a lot of other influences. The global energy balance, temperature and precipitation are influenced by a lot of natural and anthropogenic forcings in addition to CO2. Aerosols are particularly problematic since they offset the warming effect of CO2 and influence cloud formation directly. Since data for total GHG loads (CO2eq), total forcing and temperature, which are more proximate in the causal chain to precipitation, are readily available, using CO2 alone seems like willful ignorance. The authors also discuss issues “downstream” in the causal chain, with difficult-to-assess changes due to human disturbance of watersheds; while these seem plausible (not my area), they are not a good argument for the use of CO2. The authors also test other factors by including oscillatory climate indices, the AMO, PDO and ENSO, but these don’t address the problem either.

Third, the hypothesis that streamflow depends on global mean CO2 is a strawman. Climate models don’t predict that the hydrologic cycle will accelerate uniformly everywhere. Rising global mean temperature and precipitation are merely aggregate indicators of a more complex regional fingerprint. If one wants to evaluate the hypothesis that CO2 affects streamflow, one ought to compare observed streamflow trends with something like the model-predicted spatial pattern of precipitation anomalies. Here’s North America in AR4 WG1 Fig. 11.12, with late-21st-century precipitation anomalies, for example:
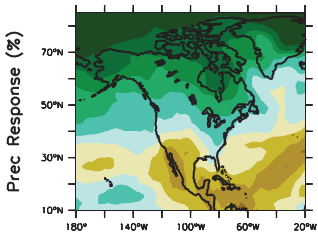
The pattern looks suspiciously like the paper’s spatial distribution of regression coefficients:
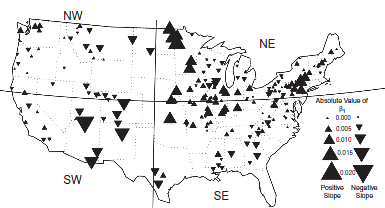
The eyeball correlation in itself doesn’t prove anything, but it’s suggestive that something has been missed.

Fourth, the treatment of nonlinearity and distributions is a bit fishy. The relationship between CO2 and forcing is logarithmic, which is captured in the regression equation, but I’m surprised that there aren’t other important nonlinearities or nonnormalities. Isn’t flooding heavy-tailed, for example? I’d like to see just a bit more physics in the model to handle such issues.

Fifth, I question the approach of estimating each watershed individually, then examining the distribution of results. The signal to noise ratio on any individual watershed is probably pretty horrible, so one ought to be able to do a lot better with some spatial pooling of the betas (which would also help with issue three above).

I think that it’s actually interesting to hold your nose and use linear regression as a simple screening tool, in spite of violated assumptions. If a relationship is strong, you may still find it. If you don’t find it, that may not tell you much, other than that you need better methods. The authors seem to hold to this philosophy in the conclusion, though it doesn’t come across that way in the abstract. Not everyone is as careful though; Roger Pielke Jr. picked up this paper and read it as,

Are US Floods Increasing? The Answer is Still No.

A new paper out today in the Hydrological Sciences Journal shows that flooding has not increased in the United States over records of 85 to 127 years. This adds to a pile of research that shows similar results around the world. This result is of course consistent with our work that shows that increasing damage related to weather extremes can be entirely explained by societal changes, such as more property in harm’s way. In fact, in the US flood damage has decreased dramatically as a fraction of GDP, which is exactly whet you get if GDP goes up and flooding does not.

Actually, the paper doesn’t even address whether floods are increasing or decreasing. It evaluates CO2 correlations, not temporal trends. To the extent that CO2 has increased monotonically, the regression will capture some trend in the betas on CO2, but it’s not the same thing.