Minds are like parachutes, or are they dumpsters?

Open Minds has yet another post in a long series demolishing bizarre views of climate skeptics, particularly those from WattsUpWithThat. Several of the targets are nice violations of conservation laws and bathtub dynamics. For example, how can you believe that the ocean is the source of rising atmospheric CO2, when atmospheric CO2 increases by less than human emissions and ocean CO2 is also rising?

The alarming thing about this is that, if I squint and forget that I know anything about dynamics, some of the rubbish sounds like science. For example,

The prevailing paradigm simply does not make sense from a stochastic systems point of view – it is essentially self-refuting. A very low bandwidth system, such as it demands, would not be able to have maintained CO2 levels in a tight band during the pre-industrial era and then suddenly started accumulating our inputs. It would have been driven by random events into a random walk with dispersion increasing as the square root of time. I have been aware of this disconnect for some time. When I found the glaringly evident temperature to CO2 derivative relationship, I knew I had found proof. It just does not make any sense otherwise. Temperature drives atmospheric CO2, and human inputs are negligible. Case closed.

I suspect that a lot of people would have trouble distinguishing this foolishness from sense. In fact, it’s tough to precisely articulate what’s wrong with this statement, because it falls so far short of a runnable model specification. I also suspect that I would have trouble distinguishing similar foolishness from sense in some other field, say biochemistry, if I were unfamiliar with the content and jargon.

This reinforces my conviction that words are inadequate for discussing complex, quantitative problems. Verbal descriptions of dynamic mental models hide all kinds of inconsistencies and are generally impossible to reliably test and refute. If you don’t have a formal model, you’ve brought a knife, or maybe a banana, to a gunfight.

There are two remedies for this. We need more formal mathematical model literacy, and more humility about mental models and verbal arguments.

Reading between the lines

… on another incoherent Breakthrough editorial:

The Creative Destruction of Climate Economics

In the 70 years that have passed since Joseph Schumpeter coined the term “creative destruction,” economists have struggled awkwardly with how to think about growth and innovation. Born of the low-growth agricultural economies of 18th Century Europe, the dismal science to this day remains focused on the question of how to most efficiently distribute scarce resources, not on how to create new ones — this despite two centuries of rapid economic growth driven by disruptive technologies, from the steam engine to electricity to the Internet.

Perhaps the authors should consult the two million references on Google scholar to endogenous growth and endogenous technology, or read some Marx. Continue reading “Reading between the lines”

Unskeptical skepticism

Atmospheric CO2 doesn’t drive temperature, and temperature doesn’t drive CO2. They drive each other, in a feedback loop. Each relationship involves integration – CO2 accumulates temperature changes through mechanisms like forest growth and ocean uptake, and temperature is the accumulation of heat flux controlled by the radiative effects of CO2.

This has been obvious for at least decades, yet it still eludes many. A favorite counter-argument for an influence of CO2 on temperature has long been the observation that temperature appears to lead CO2 at turning points in the ice core record. Naively, this violates the requirement for establishing causality, that cause must precede effect. But climate is not a simple system with binary states and events, discrete time and single causes. In a feedback system, the fact that X lags Y by some discernible amount doesn’t rule out an influence of Y on X; in fact such bidirectional causality is essential for simple oscillators.

A newish paper by Shakun et al. sheds some light on the issue of ice age turning points. It turns out that much of the issue is a matter of data – that ice core records are not representative of global temperatures. But it still appears that CO2 is not the triggering mechanism for deglaciation. The authors speculate that the trigger is northern hemisphere temperatures, presumably driven by orbital insolation changes, followed by changes in ocean circulation. Then CO2 kicks in as amplifier. Simulation backs this up, though it appears to me from figure 3 that models capture the qualitative dynamics, but underpredict the total variance in temperature over the period. To me, this is an interesting step toward a more complete understanding of ice age terminations, but I’ll wait for a few more papers before accepting declarations of victory on the topic.

Predictably, climate skeptics hate this paper. For example, consider Master Tricksed Us! at WattsUpWithThat. Commenters positively drool over the implication that Shakun et al. “hid the incline” by declining to show the last 6000 years for proxy temperature/CO2 relationship.

I leave the readers to consider the fact that for most of the Holocene, eight millennia or so, half a dozen different ice core records say that CO2 levels were rising pretty fast by geological standards … and despite that, the temperatures have been dropping over the last eight millennia …

But not so fast. First, there’s no skepticism about the data. Perhaps Shakun et al. omitted the last 6k years for a good reason, like homogeneity. A spot check indicates that there might be issues – series MD95-2037 ends in the year 6838 BP, for example. So, perhaps the WUWT graph merely shows spatial selection bias in the dataset. Second, the implication that rising CO2 and falling temperatures somehow disproves a CO2->temperature link is yet another failure to appreciate bathtub dynamics and multivariate causality.

This credulous fawning over the slightest hint of a crack in mainstream theory strikes me as the opposite of skepticism. The essence of a skeptical attitude, I think, is to avoid early lock-in to any one pet theory or data stream. Winning theories emerge from testing lots of theories against lots of constraints. That requires continual questioning of models and data, but also questioning of the questions. Objections that violate physics like accumulation, or heaps of mutually exclusive objections, have to be discarded like any other failed theory. The process should involve more than fools asking more questions than a wise man can answer. At the end of the day, “no theory is possible” is itself a theory that implies null predictions that can be falsified like any other, if it’s been stated explicitly enough.

Burt Rutan's climate causality confusion

I’ve always thought Burt Rutan was pretty cool, so I was rather disappointed when he signed on to a shady climate op-ed in the WSJ (along with Scott Armstrong). I was curious what Rutan’s mental model was, so I googled and found his arguments summarized in an extensive slide deck, available here.

It would probably take me 98 posts to detail the problems with these 98 slides, so I’ll just summarize a few that are particularly noteworthy from the perspective of learning about complex systems.

Data Quality

Rutan claims to be motivated by data fraud,

In my background of 46 years in aerospace flight testing and design I have seen many examples of data presentation fraud. That is what prompted my interest in seeing how the scientists have processed the climate data, presented it and promoted their theories to policy makers and the media. (here)

This is ironic, because he credulously relies on much fraudulent data. For example, slide 18 attempts to show that CO2 concentrations were actually much higher in the 19th century. But that’s bogus, because many of those measurements were from urban areas or otherwise subject to large measurement errors and bias. You can reject many of the data points on first principles, because they imply physically impossible carbon fluxes (500 billion tons in one year).

Slides 32-34 also present some rather grossly distorted comparisons of data and projections, complete with attributions of temperature cycles that appear to bear no relationship to the data (Slide 33, right figure, red line).

Slides 50+ discuss the urban heat island effect and surfacestations.org effort. Somehow they neglect to mention that the outcome of all of that was a cool bias in the data, not a warm bias.

Bathtub Dynamics

Slides 27 and 28 seek a correlation between the CO2 and temperature time series. Failure is considered evidence that temperature is not significantly influenced by CO2. But this is a basic failure to appreciate bathtub dynamics. Temperature is an indicator of the accumulation of heat. Heat integrates radiative flux, which depends on GHG concentrations. So, even in a perfect system where CO2 is the only causal influence on temperature, we would not expect to see matching temporal trends in emissions, concentrations, and temperatures. How do you escape engineering school and design airplanes without knowing about integration?

Correlation and causation

Slide 28 also engages in the fallacy of the single cause and denying the antecedent. It proposes that, because warming rates were roughly the same from 1915-1945 and 1970-2000, while CO2 concentrations varied, CO2 cannot be the cause of the observations. This of course presumes (falsely) that CO2 is the only influence on temperatures, neglecting volcanoes, endogenous natural variability, etc., not to mention blatantly cherry-picking arbitrary intervals.

Slide 14 shows another misattribution of single cause, comparing CO2 and temperature over 600 million years, ignoring little things like changes in the configuration of the continents and output of the sun over that long period.

In spite of the fact that Rutan generally argues against correlation as evidence for causation, Slide 46 presents correlations between orbital factors and sunspots (the latter smoothed in some arbitrary way) as evidence that these factors do drive temperature.

Feedback

Slide 29 shows temperature leading CO2 in ice core records, concluding that temperature must drive CO2, and not the reverse. In reality, temperature and CO2 drive one another in a feedback loop. That turning points in temperature sometimes lead turning points in CO2 does not preclude CO2 from acting as an amplifier of temperature changes. (Recently there has been a little progress on this point.)

Too small to matter

Slide 12 indicates that CO2 concentrations are too small to make a difference, which has no physical basis, other than the general misconception that small numbers don’t matter.

Computer models are not evidence

So Rutan claims on slide 47. Of course this is true in a trivial sense, because one can always build arbitrary models that bear no relationship to anything.

But why single out computer models? Mental models and pencil-and-paper calculations are not uniquely privileged. They are just as likely to fail to conform to data, laws of physics, and rules of logic as a computer model. In fact, because they’re not stated formally, testable automatically, or easily shared and critiqued, they’re more likely to contain some flaws, particularly mathematical ones. The more complex a problem becomes, the more the balance tips in favor of formal (computer) models, particularly in non-experimental sciences where trial-and-error is not practical.

There’s also no such thing as model-free inference. Rutan presents many of his charts as if data speaks for itself. In fact, no measurements can be taken without a model of the underlying process to be measured (in a thermometer, the thermal expansion of a fluid). More importantly, event the simplest trend calculation or comparison of time series implies a model. Leaving that model unstated just makes it easier to engage in bathtub fallacies and other errors in reasoning.

The bottom line

The problem here is that Rutan has no computer model. So, he feels free to assemble a dog’s breakfast of data, sourced from illustrious scientific institutions like the Heritage Foundation (slide 12), and call it evidence. Because he skips the exercise of trying to put everything into a rigorous formal feedback model, he’s received no warning signs that he has strayed far from reality.

I find this all rather disheartening. Clearly it is easy for a smart, technical person to be wildly incompetent outside his original field of expertise. But worse, it’s even easy for them to assemble a portfolio of pseudoscience that looks like evidence, capitalizing on past achievements to sucker a loyal following.

Strange times for Europe's aviation carbon tax

The whole global climate negotiation process is a bit of a sideshow, in that negotiators don’t have the freedom to actually agree to anything meaningful. When they head to Poznan, or Copenhagen, or Durban, they get their briefings from finance and economic ministries, not environment ministries. The mandates are evidently that there’s no way most countries will agree to anything like the significant emissions cuts needed to achieve stabilization.

That’s particularly clear at the moment, with Europe imposing a carbon fee on flights using their airspace, and facing broad opposition. And what opponent makes the biggest headlines? India’s environment minister – possibly the person on the planet who should be happiest to see any kind of meaningful emissions policy anywhere.

Clearly, climate is not driving the bus.

Gas – a bridge to nowhere?

NPR has a nice piece on the US natural gas boom.

Henry Jacoby, an economist at the Center for Energy and Environmental Policy Research at MIT, says cheap energy will help pump up the economy.

“Overall, this is a great boon to the United States,” he says. “It’s not a bad thing to have this new and available domestic resource.” He says cheap energy can boost the economy, and he notes that natural gas is half as polluting as coal when it’s burned for electricity.

“But we have to keep our eye on the ball long-term,” Jacoby says. He’s concerned about how cheap gas will affect much cleaner sources of energy. Wind and solar power are more expensive than natural gas, and though those prices have been coming down, they’re chasing a moving target that has fallen fast: natural gas.

“It makes the prospects for large-scale expansion of those technologies more chancy,” Jacoby says.

From an environmental perspective, natural gas could help transition our economy from fossil fuels to clean energy. It’s often portrayed as a bridge fuel to help us through the transition, because it’s so much cleaner than coal and it’s abundant. But Jacoby says that bridge could be in trouble if cheap gas kills the incentive to develop renewable industry.

“You’d better be thinking about a landing of the bridge at the other end. If there’s no landing at the other end, it’s just a bridge to nowhere,” he says.

(For those who don’t know, Jake Jacoby is not a warm-fuzzy greenie; he’s a hard line economist who leads a big general equilibrium modeling project, but also takes climate science seriously).

For me, the key takeaways are:

  • Gas beats coal, and may have other useful roles to play. For example, gas backup might be a low-capital-cost complement to variable renewables, with minor emissions consequences.
  • It’s better to have more resources than less.
  • Whether the opportunity of greater resources translates into a benefit depends on whether the price of gas accounts for full costs.

The last item is a problem. In the US, the price of greenhouse emissions from gas (or anything else) is approximately zero. The effective prices of other environmental consequences – air quality, pollution from fracking, etc. – are also low. Depletion rents for gas are probably also too low, because the abundance of gas is overhyped, and public resources were suboptimally over-allocated decades ago. Low depletion rents encourage a painful boom/bust of gas supply.

Not only physical assets are mispriced. Another part of the story is learning-by-doing, deliberate R&D, and economies of scale – positive feedbacks that grow the market for low-emissions technologies. Firms producing new tech like PV or wind turbines are only able to appropriate part of the profits of their innovations. The rest spills over to benefit society more generally. Too-cheap gas undercuts these reinforcing mechanisms, so gas substitutes aren’t available when scarcity inevitably returns, hence the “bridge to nowhere” dynamic.

Long-term renewable deployment in the U.S. is going to depend primarily on policy. Is there enough concern about environmental consequences to put in place incentives for renewable energy?

Trevor Houser, energy analyst, Rhodium Group

They key is, what kind of policy? Currently, we rely primarily on performance standards and subsidies. These aren’t getting the job done, for structural reasons. For example, subsidies are self-extinguishing, because they get too expensive to sustain when the target gets too big (think solar feed-in-tariffs in Europe). They’re also politically vulnerable to apparently-cheap alternatives:

“If those prices hang around for another three or four years, then I think you’ll definitely see reduced political will for renewable energy deployment, ” Houser says

The basic problem is that the mindset of subsidizing or requiring “good” technologies makes them feel like luxuries for rich altruists, even though the apparently-cheap alternatives may be merely penny-wise and pound-foolish. The essential alternative is to price the bads, with the logic that people who want to use technologies that harm others ought to at least pay for the privilege. If we can’t manage to do that, I don’t think there’s much hope of getting gas or climate policy right.

Linear regression bathtub FAIL

I seldom run across an example of so many things that can go wrong with linear regression in one place, but one just crossed my reader.

A new paper examines the relationship between CO2 concentration and flooding in the US, and finds no significant impact:

Has the magnitude of floods across the USA changed with global CO2 levels?

R. M. Hirsch & K. R. Ryberg

Abstract

Statistical relationships between annual floods at 200 long-term (85–127 years of record) streamgauges in the coterminous United States and the global mean carbon dioxide concentration (GMCO2) record are explored. The streamgauge locations are limited to those with little or no regulation or urban development. The coterminous US is divided into four large regions and stationary bootstrapping is used to evaluate if the patterns of these statistical associations are significantly different from what would be expected under the null hypothesis that flood magnitudes are independent of GMCO2. In none of the four regions defined in this study is there strong statistical evidence for flood magnitudes increasing with increasing GMCO2. One region, the southwest, showed a statistically significant negative relationship between GMCO2 and flood magnitudes. The statistical methods applied compensate both for the inter-site correlation of flood magnitudes and the shorter-term (up to a few decades) serial correlation of floods.

There are several serious problems here.

First, it ignores bathtub dynamics. The authors describe causality from CO2 -> energy balance -> temperature & precipitation -> flooding. But they regress:

ln(peak streamflow) = beta0 + beta1 × global mean CO2 + error

That alone is a fatal gaffe, because temperature and precipitation depend on the integration of the global energy balance. Integration renders simple pattern matching of cause and effect invalid. For example, if A influences B, with B as the integral of A, and A grows linearly with time, B will grow quadratically with time. The situation is actually worse than that for climate, because the system is not first order; you need at least a second-order model to do a decent job of approximating the global dynamics, and much higher order models to even think about simulating regional effects. At the very least, the authors might have explored the usual approach of taking first differences to undo the integration, though it seems likely that the data are too noisy for this to reveal much.

Second, it ignores a lot of other influences. The global energy balance, temperature and precipitation are influenced by a lot of natural and anthropogenic forcings in addition to CO2. Aerosols are particularly problematic since they offset the warming effect of CO2 and influence cloud formation directly. Since data for total GHG loads (CO2eq), total forcing and temperature, which are more proximate in the causal chain to precipitation, are readily available, using CO2 alone seems like willful ignorance. The authors also discuss issues “downstream” in the causal chain, with difficult-to-assess changes due to human disturbance of watersheds; while these seem plausible (not my area), they are not a good argument for the use of CO2. The authors also test other factors by including oscillatory climate indices, the AMO, PDO and ENSO, but these don’t address the problem either.

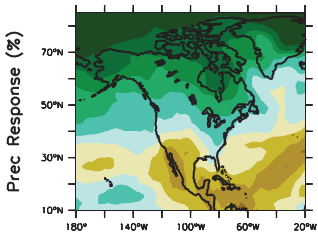
Third, the hypothesis that streamflow depends on global mean CO2 is a strawman. Climate models don’t predict that the hydrologic cycle will accelerate uniformly everywhere. Rising global mean temperature and precipitation are merely aggregate indicators of a more complex regional fingerprint. If one wants to evaluate the hypothesis that CO2 affects streamflow, one ought to compare observed streamflow trends with something like the model-predicted spatial pattern of precipitation anomalies. Here’s North America in AR4 WG1 Fig. 11.12, with late-21st-century precipitation anomalies, for example:

The pattern looks suspiciously like the paper’s spatial distribution of regression coefficients:
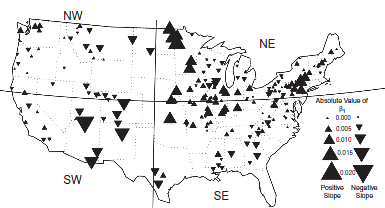
The eyeball correlation in itself doesn’t prove anything, but it’s suggestive that something has been missed.

Fourth, the treatment of nonlinearity and distributions is a bit fishy. The relationship between CO2 and forcing is logarithmic, which is captured in the regression equation, but I’m surprised that there aren’t other important nonlinearities or nonnormalities. Isn’t flooding heavy-tailed, for example? I’d like to see just a bit more physics in the model to handle such issues.

Fifth, I question the approach of estimating each watershed individually, then examining the distribution of results. The signal to noise ratio on any individual watershed is probably pretty horrible, so one ought to be able to do a lot better with some spatial pooling of the betas (which would also help with issue three above).

I think that it’s actually interesting to hold your nose and use linear regression as a simple screening tool, in spite of violated assumptions. If a relationship is strong, you may still find it. If you don’t find it, that may not tell you much, other than that you need better methods. The authors seem to hold to this philosophy in the conclusion, though it doesn’t come across that way in the abstract. Not everyone is as careful though; Roger Pielke Jr. picked up this paper and read it as,

Are US Floods Increasing? The Answer is Still No.

A new paper out today in the Hydrological Sciences Journal shows that flooding has not increased in the United States over records of 85 to 127 years. This adds to a pile of research that shows similar results around the world. This result is of course consistent with our work that shows that increasing damage related to weather extremes can be entirely explained by societal changes, such as more property in harm’s way. In fact, in the US flood damage has decreased dramatically as a fraction of GDP, which is exactly whet you get if GDP goes up and flooding does not.

Actually, the paper doesn’t even address whether floods are increasing or decreasing. It evaluates CO2 correlations, not temporal trends. To the extent that CO2 has increased monotonically, the regression will capture some trend in the betas on CO2, but it’s not the same thing.