
I’m working on raising my kids as systems thinkers. I’ve been meaning to share some of our adventures here for some time, so here’s a first installment, from quite a while back.
I decided to ignore the great online resources for system dynamics education and reinvent the wheel. But where to start? I wanted an exercise that included stocks and flows, accumulation, graph reading, estimation, and data collection, with as much excitement as could be had indoors. (It was 20 below outside, so fire and explosions weren’t an option).
We grabbed a sheet of graph paper, fat pens, a yardstick, and a stopwatch and headed for the bathtub. Step 1 (to sustain interest) was turn on the tap to fill the tub. While it filled, I drew time and depth axes on the graph paper and explained what we were trying to do. That involved explaining what a graph was for, and what locations on the axes meant (they were perhaps 5 and 6 and probably hadn’t seen a graph of behavior over time before).
When the tub was full, we made a few guesses about how long it might take to empty, then started the clock and opened the drain. Every ten or twenty seconds, we’d stop the timer, take a depth reading, and plot the result on our graph. After a few tries, the kids could place the points. About half way, we took a longer pause to discuss the trajectory so far. I proposed a few forecasts of how the second half of the tub might drain – slowing, speeding up, etc. Each of us took a guess about time-to-empty. Naturally my own guess was roughly consistent with exponential decay. Then we reopened the drain and collected data until the tub was dry.
To my astonishment, the resulting plot showed a perfectly linear decline in water depth, all the way to zero (as best we could measure). In hindsight, it’s not all that strange, because the tub tapers at the bottom, so that a constant linear decline in the outflow rate corresponds with the declining volumetric flow rate you’d expect (from decreasing pressure at the outlet as the water gets shallower). Still, I find it rather amazing that the shape of the tub (and perhaps nonlinearity in the drain’s behavior) results in such a perfectly linear trajectory.
We spent a fair amount of time further exploring bathtub dynamics, with much filling and emptying. When the quantity of water on the floor got too alarming, we moved to the sink to explore equilibrium by trying to balance the tap inflow and drain outflow, which is surprisingly difficult.
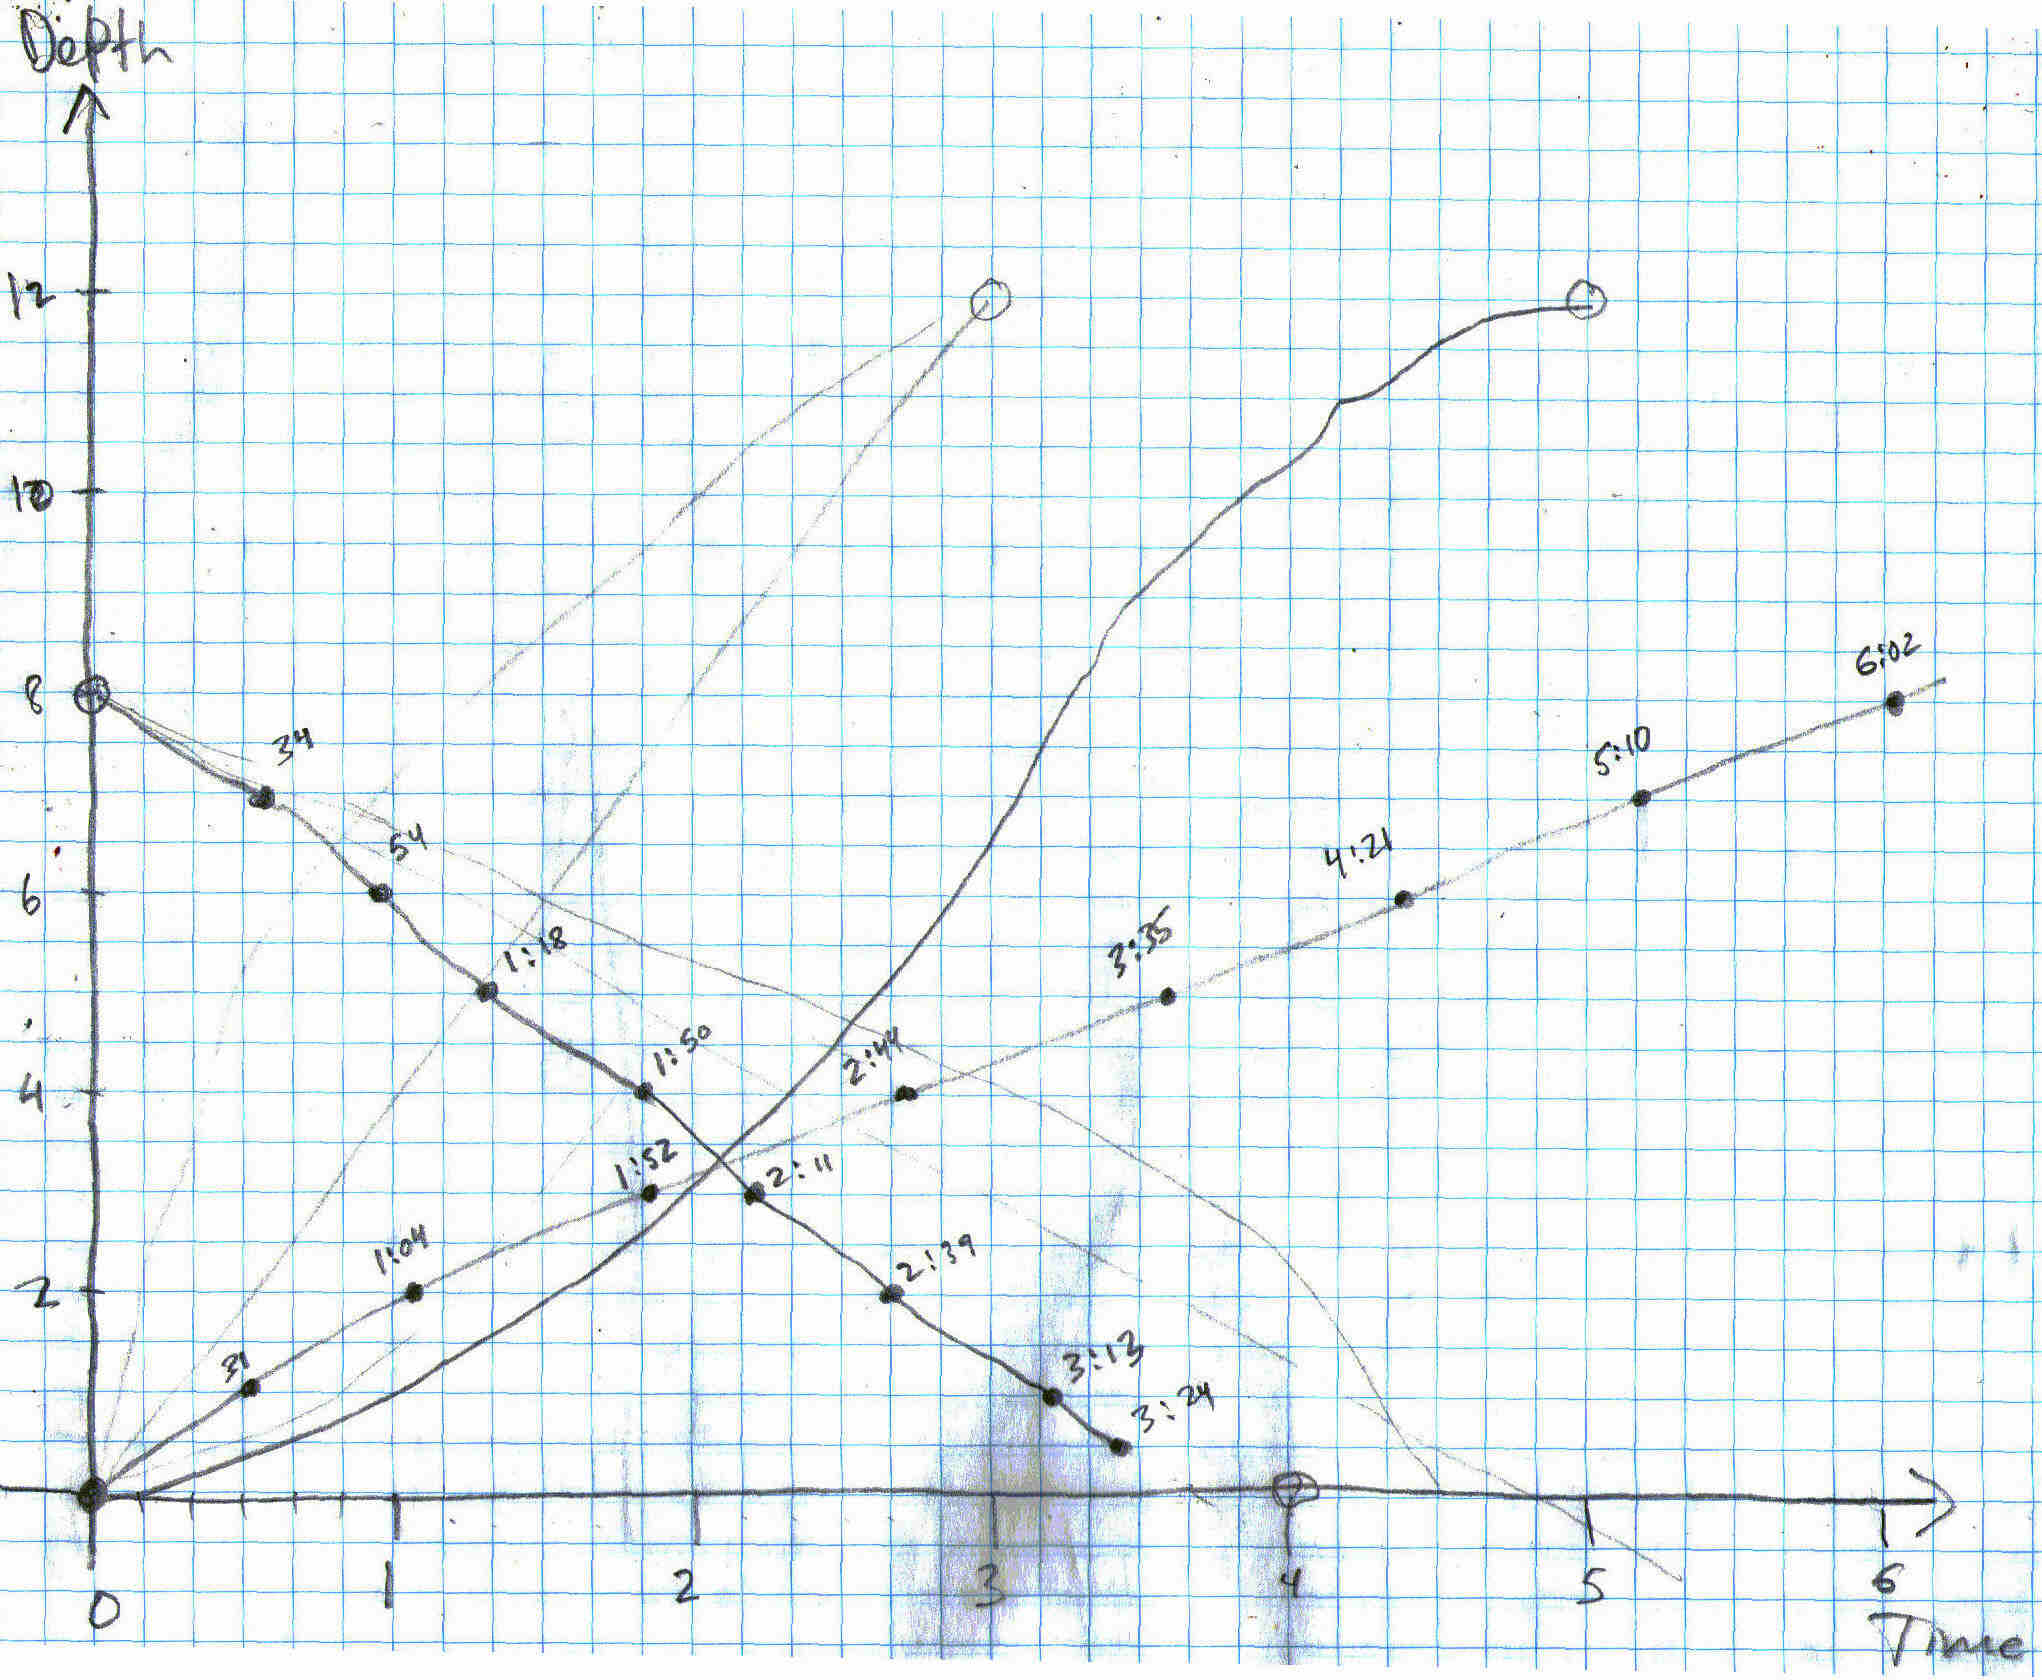
We lost track of our original results, so we recently repeated the experiment. This time, we measured the filling as well as the draining, shown below on the same axes. The dotted lines are our data; others are our prior guesses. Again, there’s no sign of exponential draining – it’s a linear rush to the finish line. Filling – which you’d expect to be a perfect ramp if the tub had constant volume per depth – is initially fast, then slows slightly as the tapered bottom area is full. However, that effect doesn’t seem to be big enough to explain the outflow behavior.
I’ve just realized that I have a straight-sided horse trough lying about, so I think we may need to head outside for another test …
Update: the follow-on to this is rather important.