I’m on an obscure email list for a statistical downscaling model. I think I’ve gotten about 10 messages in the last two years. But today, that changed.

List traffic (data in red).
Around 7 am, there were a couple of innocuous, topical messages. That prompted someone who’d evidently long forgotten about the list to send an “unsubscribe me” message to the whole list. (Why people can’t figure out that such missives are both ineffective and poor list etiquette is beyond me.) That unleashed a latent vicious cycle: monkey-see, monkey-do produced a few more “unsub” messages. Soon the traffic level became obnoxious, spawning more and more ineffectual unsubs. Then, the brakes kicked in, as more sensible users appealed to people to quit replying to the whole list. Those messages were largely lost in the sea of useless unsubs, and contributed to the overall impression that things were out of control.
People got testy:
I will reply to all to make my point.
Has it occurred to any of you idiots to just reply to Xxxx Xxxx rather than hitting reply to all. Come on already, this is not rocket science here. One person made the mistake and then you all continue to repeat it.
By about 11, the fire was slowing, evidently having run out of fuel (list ignoramuses), and someone probably shut it down by noon – but not before at least a hundred unsubs had flown by.
Just for kicks, I counted the messages and put together a rough-cut Vensim model of this little boom-bust cycle:
 unsub.mdl unsub.vpm
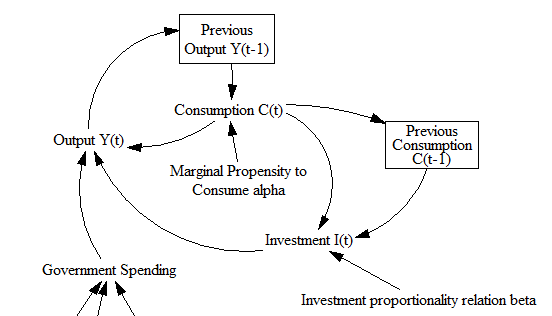
This is essentially the same structure as the Bass Diffusion model, with a few refinements. I think I didn’t quite capture the unsubscriber behavior. Here, I assume that would-be unsubscribers, who think they’ve left the list but haven’t, at least quit sending messages. In reality, they didn’t – in blissful ignorance of what was going on, several sent multiple requests to be unsubscribed. I didn’t explicitly represent the braking effect (if any) of corrective comments. Also, the time constants for corrections and unsubscriptions could probably be separated. But it has the basics – a positive feedback loop driving growth in messages, and a negative feedback loop putting an end to the growth. Anyway, have fun with it.
Computing and networks have solved a lot of problems, like making logistics pipelines visible, but they’ve created as many new ones. The need for models to improve intuition and manage new problems is as great as ever.

 This deserves a model:
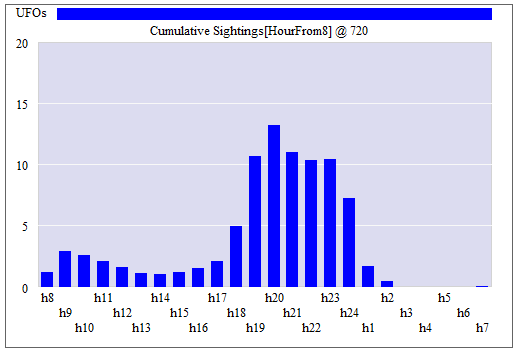 The model shows a morning peak (people awake but out and about) and a workday dip (inside, lurking near the water cooler) but the data do not. This suggests to me that: