Self-generated Seasonal Cycles

Why is Black Friday the biggest shopping day of the year? Back in 1961, Jay Forrester identified an endogenous cause in Appendix N of Industrial Dynamics, Self-generated Seasonal Cycles:

Industrial policies adopted in recognition of seasonal sales patterns may often accentuate the very seasonality from which they arise. A seasonal forecast can lead to action that may cause fulfillment of the forecast. In closed-loop systems this is a likely possibility. … any effort toward statistical isolation of a seasonal sales component will find some seasonality in the random disturbances. Should the seasonality so located lead to decisions that create actual seasonality, the process can become self-regenerative.

I think there are actually quite a few reinforcing feedback mechanisms, some of which cross consumer-business stovepipes and therefore are difficult to address.

Before heading to the mall, it’s a good day to think about stuff.

Update: another interesting take.

Et tu, Groupon?

Is Groupon overvalued too? Modeling Groupon actually proved a bit more challenging than my last post on Facebook.

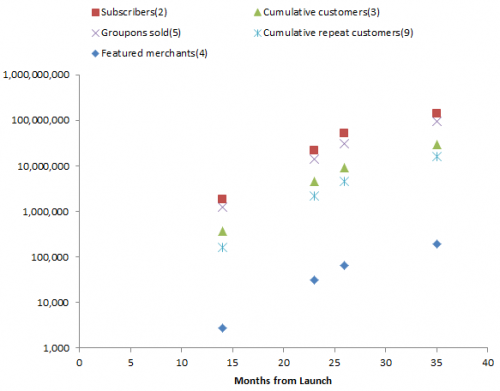
Again, I followed in the footsteps of Cauwels & Sornette, starting with the SEC filing data they used, with an update via google. C&S fit a logistic to Groupon’s cumulative repeat sales. That’s actually the end of a cascade of participation metrics, all of which show logistic growth:

The variable of greatest interest with respect to revenue is Groupons sold. But the others also play a role in determining costs – it takes money to acquire and retain customers. Also, there are actually two populations growing logistically – users and merchants. Growth is presumably a function of the interaction between these two populations. The attractiveness of Groupon to customers depends on having good deals on offer, and the attractiveness to merchants depends on having a large customer pool.

I decided to start with the customer side. The customer supply chain looks something like this:

Subscribers data includes all three stocks, cumulative customers is the right two, and cumulative repeat customers is just the rightmost.

Continue reading “Et tu, Groupon?”

Time to short some social network stocks?

I don’t want to wallow too long in metaphors, so here’s something with a few equations.

A recent arXiv paper by Peter Cauwels and Didier Sornette examines market projections for Facebook and Groupon, and concludes that they’re wildly overvalued.

We present a novel methodology to determine the fundamental value of firms in the social-networking sector based on two ingredients: (i) revenues and profits are inherently linked to its user basis through a direct channel that has no equivalent in other sectors; (ii) the growth of the number of users can be calibrated with standard logistic growth models and allows for reliable extrapolations of the size of the business at long time horizons. We illustrate the methodology with a detailed analysis of facebook, one of the biggest of the social-media giants. There is a clear signature of a change of regime that occurred in 2010 on the growth of the number of users, from a pure exponential behavior (a paradigm for unlimited growth) to a logistic function with asymptotic plateau (a paradigm for growth in competition). […] According to our methodology, this would imply that facebook would need to increase its profit per user before the IPO by a factor of 3 to 6 in the base case scenario, 2.5 to 5 in the high growth scenario and 1.5 to 3 in the extreme growth scenario in order to meet the current, widespread, high expectations. […]

I’d argue that the basic approach, fitting a logistic to the customer base growth trajectory and multiplying by expected revenue per customer, is actually pretty ancient by modeling standards. (Most system dynamicists will be familiar with corporate growth models based on the mathematically-equivalent Bass diffusion model, for example.) So the surprise for me here is not the method, but that forecasters aren’t using it.

Looking around at some forecasts, it’s hard to say what forecasters are actually doing. There’s lots of handwaving and blather about multipliers, and little revelation of actual assumptions (unlike the paper). It appears to me that a lot of forecasters are counting on big growth in revenue per user, and not really thinking deeply about the user population at all.

To satisfy my curiosity, I grabbed the data out of Cauwels & Sornette, updated it with the latest user count and revenue projection, and repeated the logistic model analysis. A few observations:

I used a generalized logistic, which has one more parameter, capturing possible nonlinearity in the decline of the growth rate of users with increasing saturation of the market. Here’s the core model:

Continue reading “Time to short some social network stocks?”

Systems thinking & asymmetric information

At the STIA conference I played Forio’s Everest simulation, a multiplayer teamwork/leadership game, widely used in business schools.

Our team put 2 on the summit and 2 in the hospital. In the game, the unlucky climbers were rescued by helicopter, though in reality they might have ended up in the morgue as the current helicopter rescue record stands at 19,833 feet – far short of the high camps on Everest.

– Pavel Novak, Wikimedia Commons, CC Attribution Share-Alike 2.5 Generic

As the game progressed, I got itchy – where were the dynamics? Oscillations in the sherpa supply chain? Maybe a boom and bust of team performance? Certainly there were some dynamics, related to irreversible decisions to ascend and descend, but counterintuitive behavior over time was not really the focus of the game.

Instead, it was about pathologies of information sharing on teams. It turns out that several of our near-fatal incidents hinged on information held by a single team member. Just on the basis of probability, unique information is less likely to come up in team deliberations. But it turns out that this is reinforced by reinforcement bias that favors processing of shared information, to the detriment of team performance when unique information is important. While I’d still be interested to ponder the implications of this in a dynamic setting, I found this insight valuable for its own sake.

Back in the old days there was an undercurrent of debate about whether systems thinking was a subset of system dynamics, or vice versa. While I’d like SD to be the one method to rule them all, I have to admit that there’s more to systems than dynamics. There are a lot of interesting things going on at the intersection of multiple stakeholder interests, information and mental models, even before things start evolving over time. We grapple with these issues in practically every SD engagement, but they’re not our core focus, so it’s always nice to have a little cross-fertilization.

All metaphors are wrong – some are useful

I’m hanging out at the Systems Thinking in Action conference, which has been terrific so far.

The use of metaphors came up today. A good metaphor can be a powerful tool in group decision making. It can wrap a story about structure and behavior into a little icon that’s easy to share and relate to other concepts.

But with that power comes a bit of danger, because, like models, metaphors have limits, and those limits aren’t always explicit or shared. Even the humble bathtub can be misleading. We often use bathtubs as analogies for first-order exponential decay processes, but real bathtubs have a nonlinear outflow, so they actually decay linearly. (Update: that is, the water level as a function of time falls linearly, assuming the tub has straight sides, because the rate of outflow varies with the square root of the level.)

Apart from simple caution, I think the best solution to this problem when stakes are high is to formalize and simulate systems, because that process forces you to expose and challenge many assumptions that otherwise remain hidden.

Forest Cover Tipping Points

There’s an interesting discussion of forest tipping points in a new paper in Science:

Global Resilience of Tropical Forest and Savanna to Critical Transitions

Marina Hirota, Milena Holmgren, Egbert H. Van Nes, Marten Scheffer

It has been suggested that tropical forest and savanna could represent alternative stable states, implying critical transitions at tipping points in response to altered climate or other drivers. So far, evidence for this idea has remained elusive, and integrated climate models assume smooth vegetation responses. We analyzed data on the distribution of tree cover in Africa, Australia, and South America to reveal strong evidence for the existence of three distinct attractors: forest, savanna, and a treeless state. Empirical reconstruction of the basins of attraction indicates that the resilience of the states varies in a universal way with precipitation. These results allow the identification of regions where forest or savanna may most easily tip into an alternative state, and they pave the way to a new generation of coupled climate models.

Science 14 October 2011

The paper is worth a read. It doesn’t present an explicit simulation model, but it does describe the concept nicely. The basic observation is that there’s clustering in the distribution of forest cover vs. precipitation:

Hirota et al., Science 14 October 2011

In the normal regression mindset, you’d observe that some places with 2m rainfall are savannas, and others are forests, and go looking for other explanatory variables (soil, latitude, …) that explain the difference. You might learn something, or you might get into trouble if forest cover is not-only nonlinear in various inputs, but state-dependent. The authors pursue the latter thought: that there may be multiple stable states for forest cover at a given level of precipitation.

They use the precipitation-forest cover distribution and the observation that, in a first-order system subject to noise, the distribution of observed forest cover reveals something about the potential function for forest cover. Using kernel smoothing, they reconstruct the forest potential functions for various levels of precipitation:
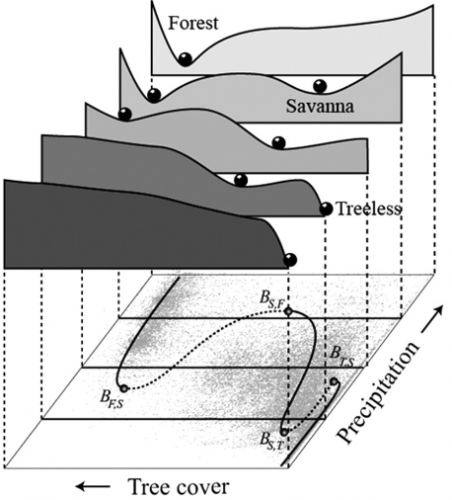
Hirota et al., Science 14 October 2011

I thought that looked fun to play with, so I built a little model that qualitatively captures the dynamics:

The tricky part was reconstructing the potential function without the data. It turned out to be easier to write the rate equation for forest cover change at medium precipitation (“change function” in the model), and then tilt it with an added term when precipitation is high or low. Then the potential function is reconstructed from its relationship to the derivative, dz/dt = f(z) = -dV/dz, where z is forest cover and V is the potential.

That yields the following potentials and vector fields (rates of change) at low, medium and high precipitation:
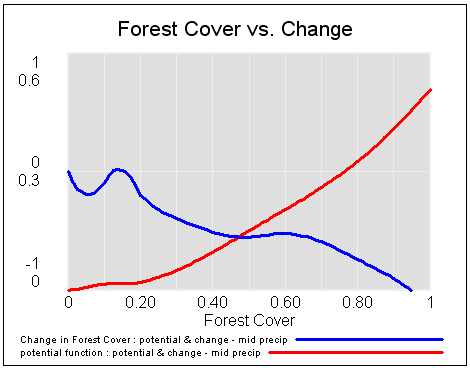
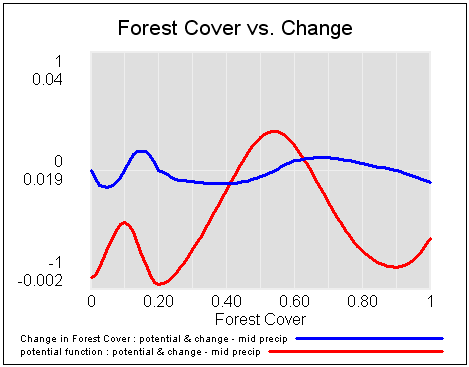
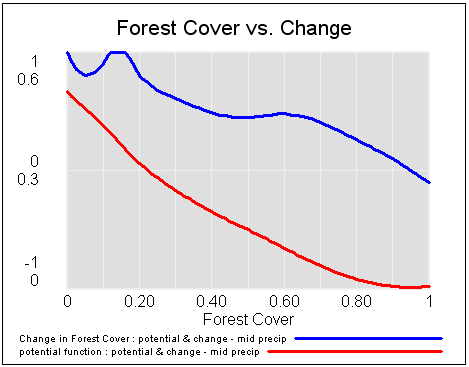
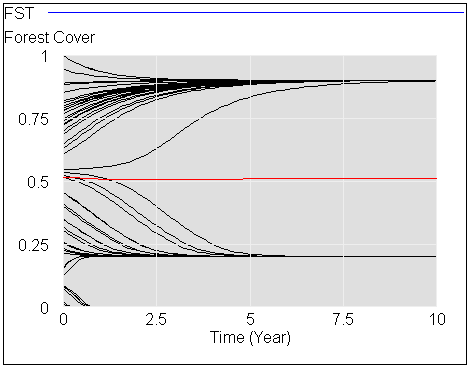
If you start this system at different levels of forest cover, for medium precipitation, you can see the three stable attractors at zero trees, savanna (20% tree cover) and forest (90% tree cover).
If you start with a stable forest, and a bit of noise, then gradually reduce precipitation, you can see that the forest response is not smooth.
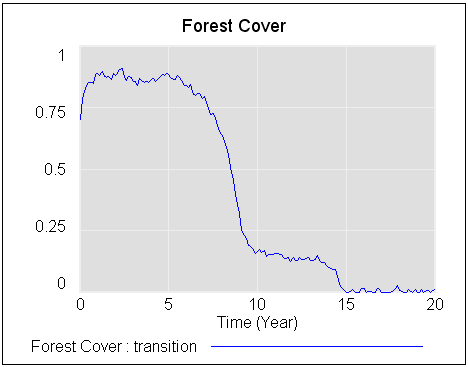
The forest is stable until about year 8, then transitions abruptly to savanna. Finally, around year 14, the savanna disappears and is replaced by a treeless state. The forest doesn’t transition to savanna until the precipitation index reaches about .3, even though savanna becomes the more stable of the two states much sooner, at precipitation of about .55. And, while the savanna state doesn’t become entirely unstable at low precipitation, noise carries the system over the threshold to the lower-potential treeless state.

The net result is that thinking about such a system from a static, linear perspective will get you into trouble. And, if you live around such a system, subject to a changing climate, transitions could be abrupt and surprising (fire might be one tipping mechanism).

The model is in my library.

Fight or flight in resource modeling

A nice reflection on modeling in emotionally charged situations, from Drew Jones, Don Seville & Donella Meadows, Resource Sustainability in Commodity Systems: The Sawmill Industry in the Northern Forest:

Through the workshops and discussions about the forest economy, we also learned that even raising questions of growth and limits can trigger strong defensive routines …, both at the individual level and the organizational level, that make it difficult even to remain engaged in thinking about ecological limits and, therefore, taking any action. Managing these complex process challenges effectively was essential to using systems modeling to help people move towards well-reasoned action or inaction.

… We were presenting our base run to a group of mill executives and landowners from five different companies. During the walk-through of the base-run behavior of mill capacity (which begins to contract severely several decades in the future) we found that a few participants quickly dismissed that possibility, saying, ‘‘Sawmill capacity in this region will never shrink like that,’’ and aggressively pressing us on what factors we had included so that (we presume) they could uncover something missing or incorrect and dismiss the findings. Their body language and tone of voice led us to believe the participants were angry and emotionally charged.

… we came to identify a recurring set of defensive routines, that is, both emotionally laden reflexive responses to seeing the graphs of overshoot in which participants did not connect their critique to an underlying structural theory, or simply disengaged from thinking about the questions at hand. … When we encountered these reactions, we found ourselves torn between avoiding the conflict (the ‘‘flight’’ reaction; modifying our story to fit within their pre-existing assumptions, de-emphasizing the behavior of the model and switching to interview mode, talking about the systems methodology rather than implications of this particular model) or by pushing harder on our own viewpoint (the ‘‘fight’’ reaction; explaining why our assumptions are right, defending the logic behind our model). Neither of these responses was effective.

Back to the presentation to the industry group. During a break, after we had just survived the morning’s tensions and had struggled to avoid ‘‘fight or flight,’’ Dana [Meadows] walked up to us, smiling, and said, ‘‘Isn’t this going great?’’ ‘‘What?!?,’’ we thought.

‘‘The main purpose of our modeling,’’ she said ‘‘is to bring people to this moment—the moment of discomfort, of cognitive dissonance, where they can begin to see how current ways of thinking and their deeply held beliefs are not working anymore, how they are creating a future that they don’t want. The key as a modeler who triggers denial or apathy is to bring the group to this moment, and then just breathe. Hold us there for as long as possible. Don’t fight back. Don’t qualify your conclusions about what structures create what behaviors. State them clearly, and then just hold on.’’

Tipping points

The concept of tipping points is powerful, but sometimes a bit muddled. Things that get described as tipping points often sound to me like mere dramatic events or nonlinear effects, simple thermodynamic irreversibilities, or exponential signals emerging unexpectedly from noise. These may play a role in tipping points, and lead to surprises, but I don’t think they capture the essence of the idea. You can see examples (good and bad) if you sift through the images describing tipping points on google.

I think of tipping points as a feedback phenomenon: positive feedback that amplifies a disturbance, such that change takes off, even if the disturbance is removed. The key outcome is a system that is stable or resistant to disturbances up to a point, beyond which surprising things may happen.

A simple example is sitting in a chair. The system has two stable equilibria: sitting upright, and lying flat on your back (tipped over). There’s also an unstable equilibrium – the precarious moment when you’re balanced on the back legs of the chair, and the force of gravity is neutral. As long as you lean just a little bit, gravity is a restoring force – it will pull you back to the desirable upright equilibrium if you pick up your feet. Lean a bit further, past the unstable tipping point, and gravity begins to pull you over backwards. Gravity gains leverage the further you lean – a positive feedback. Waving your arms and legs won’t help much; you’re going to be flat on your back.

A more generalized explanation is given  in catastrophe theory. The interesting twist is that a seemingly-stable system may acquire tipping points unexpectedly as its parameters drift into regimes that create new stable and unstable points, leading to surprises. Even without structural change to the system, its behavior mode can change unexpectedly as the state of the system moves from locally-stable territory to locally-unstable territory, which occurs due to shifting loop dominance from nonlinearities. (Think of the financial crisis and some kinds of aircraft accidents, for example.)

Anyone know some nice, simple tipping point models? I think I’ll have to mine my archives for some concrete examples…

Sharing Systems

I’m at the 30th Balaton Group meeting this week. A group of us just put our heads together to think about online approaches to teaching and sharing systems thinking and systems modeling. The basic question was, if you needed thousands of systems thinkers in a hurry, how could you scale up systems education quickly?

My list of interesting things people might want to do online:

  • Model building
    • Group model building (in the spirit of SUNY Albany work)
    • Collaborative modeling (e.g., a distributed team working on federated modules of a model, but not necessarily involving the client and group conceptualization processes)
    • Collaborative causal loop diagramming
    • Model code sharing and reuse
  • Model consumption
    • Online games (playing through a simulation in real time) – possibly multiplayer
    • Online simulations (interactive experimentation with a model) – possibly with a social aspect as at Climate Colab

Much can already be done through online model services like Forio and other means. However, I think there’s a lot more to be done. In particular, we’re weak on providing shared model transparency and quality control for any but the simplest models.

Some interesting systems & sustainability online learning links that came up in the conversation:

http://www.unep.org/ieacp/iea/

http://www.google.com/tools/dlpage/res/talkvideo/hangouts/

http://ecotippingpoints.org/

http://www.cotelco.net/

http://www.bfi.org/

http://www.seedsystems.net/

http://www.clexchange.org/

http://www.watersfoundation.org/

http://climateinteractive.org

http://www.systemdynamics.org/MITCollectionRoadMaps.htm

http://www.systemswiki.org/index.php?title=Main_Page

http://insightmaker.com/

http://forio.com/

http://dt.asu.edu/

A natural driver of increasing CO2 concentration?

You wouldn’t normally look at a sink with the tap running and conclude that the water level must be rising because the drain is backing up. Nevertheless, a physically similar idea has been popular in climate skeptic circles lately.

You actually don’t need much more than a mass balance to conclude that anthropogenic emissions are the cause of rising atmospheric CO2, but with a model and some data you can really pound a lot of nails into the coffin of the idea that temperature is somehow responsible.

This notion has been adequately debunked already, but here goes:

This is another experimental video. As before, there’s a lot of fine detail, so you may want to head over to Vimeo to view in full screen HD. I find it somewhat astonishing that it takes 45 minutes to explore a first-order model.

Here’s the model: co2corr2.vpm (runs in Vensim PLE; requires DSS or Pro for calibration optimization)

Update: a new copy, replacing a GET DATA FIRST TIME call to permit running with simpler versions of Vensim. co2corr3.vpm