Forrester on the Financial Crisis

Jay Forrester writes on the SD email list:

First, the current crisis did not start with the burst housing bubble. It started with the excessive credit that led to the housing bubble. That excess credit resulted from the Federal Reserve holding down interest rates to less than the inflation rate in housing. This negative real interest rate (bank interest minus inflation in the housing assets) produced a powerful incentive for investment and speculation in housing. And the action of the Federal Reserve, with the increase in risk taking by banks, were a result of pressure from Congress and the public who were all enjoying the short-term rise in housing prices.

We see here one of the characteristics of a complex social system in which a policy that is good in the short run is almost always bad in the long run. Feeding the bubble with easy credit was popular in the short run but now we have the consequent day of reckoning with the collapse of the financial system.

Continue reading “Forrester on the Financial Crisis”

Climate, the Bailout, and the Blame Game

I’ve been watching a variety of explanations of the financial crisis. As a wise friend noticed, the only thing in short supply is acceptance of responsibility. I’ve seen theories that place the seminal event as far back as the Carter administration. Does that make sense, causally?

In a formal sense, it might in some cases. I could have inhaled a carcinogen a decade ago that only leads to cancer a decade from now, without any outside triggers. But I think that sort of system is a rarity. As a practical matter, we have to look elsewhere.

Socioeconomic systems are at a constant slow boil, with many potential threats existing below the threshold of imminent danger at any given time. Occasionally, one grows exponentially and emerges as a real catastrophe. It seems like a surprise, because of the hockey stick behavior of growth (the French riddle of the lily pond again). However, most apparent low-level threats never emerge from the noise. They don’t have enough gain to grow fast, or they get shut down by some unsuspected negative feedback.

Continue reading “Climate, the Bailout, and the Blame Game”

There's always something more pressing …

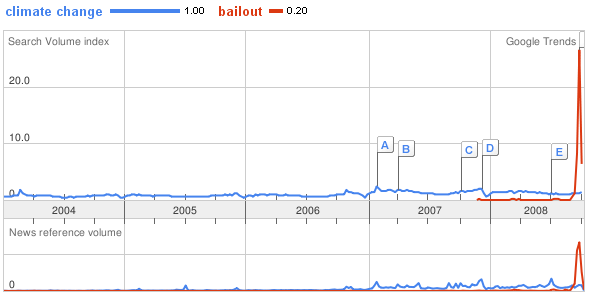
One reason long-term environmental issues like climate change are so hard to solve is that there’s always something else to do that seems more immediately pressing. War? Energy crisis? Financial meltdown? Those grab headlines, leaving the long-term problems for the slow news days:

Google trends - climate change vs. bailout

Google Trends

In this case, I don’t think slow and steady wins the race. The financial sector gets a trillion dollars in one year, and climate policy gets the Copenhagen Consensus.

Continue reading “There's always something more pressing …”

Jay Forrester honored in POMS

Production and Operations Management 17(4) honors Jay Forrester as an important person in the history of operations management. He joins Kenneth Arrow, Ronald Coase, and William Cooper in the distinction this year. Congratulations Jay!

Hat tip to John Sterman on the SD email list. I don’t have fulltext access to the journal, but if someone sends me a snippet, I’ll post it.

How To Fix A Carbon Tax

Imagine that you and I live in a place that has just implemented a carbon tax. I, being a little greener than you, complain that the tax isn’t high enough, in that it’s not causing emissions to stabilize or fall. As a remedy, I propose the following:

  • At intervals, a board will set targets for emissions, and announce them in advance for the next three years.
  • On a daily basis, the board will review current emissions to see if they’re on track to meet the annual target.
  • The daily review will take account of such things as expectations about growth, the business cycle, weather (as it affects electric power and heating demand), and changing fuel prices.
  • Based on its review, the board will post a daily value for the carbon tax, to ensure that the target is met.

Sound crazy? Welcome to cap and trade. The only difference is that the board’s daily review is distributed via a market. The presence of a market doesn’t change the fact that emissions trading has its gains backwards: rapid adjustment of prices to achieve an emissions target that can only be modified infrequently (the latter due to the need to set stable quantity expectations). Willingness to set a cap at a level below whatever a tax achieves is equivalent to accepting a higher price of carbon. Why not just raise the tax, and have lower transaction costs, broader sector coverage, and less volatility to boot?

Certainly cap and trade is a viable second-best policy, especially if augmented with a safety valve or a variable-quantity auction providing some supply-side elasticity. However, I find the scenario playing out in BC quite bizarre.

Update: more detailed thoughts on taxes and trading in this article.

Tangible Models

MIT researchers have developed a cool digital drawing board that simulates the physics of simple systems:

You can play with something like this with Crayon Physics or Magic Pen. Digital physics works because the laws involved are fairly simple, though the math behind one of these simulations might appear daunting. More importantly, they are well understood and universally agreed upon (except perhaps among perpetual motion advocates).

I’d like to have the equivalent of the digital drawing board for the public policy and business strategy space: a fluid, intuitive tool that translates assumptions into realistic consequences. The challenge is that there is no general agreement on the rules by which organizations and societies work. Frequently there is not even a clear problem statement and common definition of important variables.

However, in most domains, it is possible to identify and simulate the “physics” of a social system in a useful way. The task is particularly straightforward in cases where the social system is managing an underlying physical system that obeys predictable laws (e.g., if there’s no soup on the shelf, you can’t sell any soup). Jim Hines and MIT Media Lab researchers translated that opportunity into a digital whiteboard for supply chains, using a TUI (tangible user interface). Here’s a demonstration:

There are actually two innovations here. First, the structure of a supply chain has been reduced to a set of abstractions (inventories, connections via shipment and order flows, etc.) that make it possible to assemble one tinker-toy style using simple objects on the board. These abstractions eliminate some of the grunt work of specifying the structure of a system, enabling what Jim calls “modeling at conversation speed”. Second, assumptions, like the target stock or inventory coverage at a node in the supply chain, are tied to controls (wheels) that allow the user to vary them and see the consequences in real time (as with Vensim’s Synthesim). Getting the simulation off a single computer screen and into a tangible work environment opens up great opportunities for collaborative exploration and design of systems. Cool.

Next step: create tangible, shareable, fast tools for uncertain dynamic tasks like managing the social security trust fund or climate policy.

The Switch to Small Cars – Not So Fast

The NYT reports that a switch to efficient cars is underway, as evidenced by, among other things, an increase in market share for small cars from an eighth of the market at the height of SUV-mania to a fifth today, together with a sharp drop in large truck and SUV sales.

If sustained, such a shift would signal a very significant sensitivity of vehicle efficiency purchasing habits to fuel prices – perhaps much larger than the low short run price elasticity of gasoline demand. However, I think there is reason to interpret these recent events cautiously, lest they prove a little less astonishing in the long run. Continue reading “The Switch to Small Cars – Not So Fast”

Life Expectancy and Equity

Today ScienceDaily brought the troubling news that, “There was a steady increase in mortality inequality across the US counties between 1983 and 1999, resulting from stagnation or increase in mortality among the worst-off segment of the population.” The full article is PLoS Medicine Vol. 5, No. 4, e66 doi:10.1371/journal.pmed.0050066. ScienceDaily quotes the authors,

Ezzati said, “The finding that 4% of the male population and 19% of the female population experienced either decline or stagnation in mortality is a major public health concern.” Christopher Murray, Director of the Institute for Health Metrics and Evaluation at the University of Washington and co-author of the study, added that “life expectancy decline is something that has traditionally been considered a sign that the health and social systems have failed, as has been the case in parts of Africa and Eastern Europe. The fact that is happening to a large number of Americans should be a sign that the U.S. health system needs serious rethinking.”

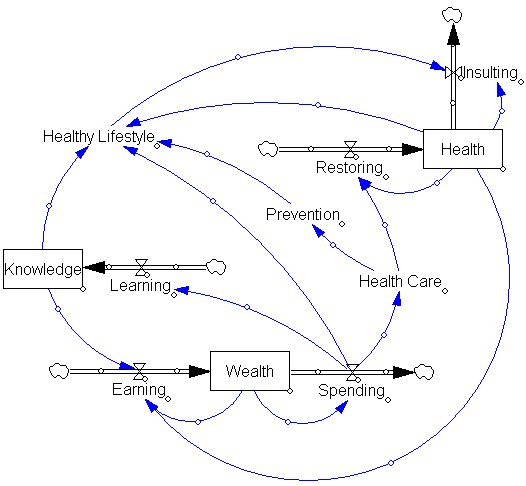
I question whether it’s just the health system that requires rethinking. Health is part of a complex system of income and wealth, education, and lifestyle choices:

Health in context

Continue reading “Life Expectancy and Equity”

On Limits to Growth

It’s a good idea to read things you criticize; checking your sources doesn’t hurt either. One of the most frequent targets of uninformed criticism, passed down from teacher to student with nary a reference to the actual text, must be The Limits to Growth. In writing my recent review of Green & Armstrong (2007), I ran across this tidbit:

Complex models (those involving nonlinearities and interactions) harm accuracy because their errors multiply. Ascher (1978), refers to the Club of Rome’s 1972 forecasts where, unaware of the research on forecasting, the developers proudly proclaimed, “in our model about 100,000 relationships are stored in the computer.” (page 999)

Setting aside the erroneous attributions about complexity, I found the statement that the MIT world models contained 100,000 relationships surprising, as both can be diagrammed on a single large page. I looked up electronic copies of World Dynamics and World3, which have 123 and 373 equations respectively. A third or more of those are inconsequential coefficients or switches for policy experiments. So how did Ascher, or Ascher’s source, get to 100,000? Perhaps by multiplying by the number of time steps over the 200 year simulation period – hardly a relevant measure of complexity.

Meadows et al. tried to steer the reader away from focusing on point forecasts. The introduction to the simulation results reads,

Each of these variables is plotted on a different vertical scale. We have deliberately omitted the vertical scales and we have made the horizontal time scale somewhat vague because we want to emphasize the general behavior modes of these computer outputs, not the numerical values, which are only approximately known. (page 123)

Many critics have blithely ignored such admonitions, and other comments to the effect of, “this is a choice, not a forecast” or “more study is needed.” Often, critics don’t even refer to the World3 runs, which are inconvenient in that none reaches overshoot in the 20th century, making it hard to establish that “LTG predicted the end of the world in year XXXX, and it didn’t happen.” Instead, critics choose the year XXXX from a table of resource lifetime indices in the chapter on nonrenewable resources (page 56), which were not forecasts at all. Continue reading “On Limits to Growth”