Dynamic Drinking

Via ScienceDaily,

A large body of social science research has established that students tend to overestimate the amount of alcohol that their peers consume. This overestimation causes many to have misguided views about whether their own behaviour is normal and may contribute to the 1.8 million alcohol related deaths every year. Social norms interventions that provide feedback about own and peer drinking behaviours may help to address these misconceptions.

Erling Moxnes has looked at this problem from a dynamic perspective, in Moxnes, E. and L. C. Jensen (in press). “Drunker than intended; misperceptions and information treatments.” Drug and Alcohol Dependence. From an earlier Athens SD conference paper,

Overshooting alcohol intoxication, an experimental study of one cause and two cures

Juveniles becoming overly intoxicated by alcohol is a widespread problem with consequences ranging from hangovers to deaths. Information campaigns to reduce this problem have not been very successful. Here we use a laboratory experiment with high school students to test the hypothesis that overshooting intoxication can follow from a misperception of the delay in alcohol absorption caused by the stomach. Using simulators with a short and a long delay, we find that the longer delay causes a severe overshoot in the blood alcohol concentration. Behaviour is well explained by a simple feedback strategy. Verbal information about the delay does not lead to a significant reduction of the overshoot, while a pre test mouse-simulator experience removes the overshoot. The latter policy helps juveniles lessen undesired consequences of drinking while preserving the perceived positive effects. The next step should be an investigation of simulator experience on real drinking behaviour.

Good modeling practices

Some thoughts I’ve been collecting, primarily oriented toward system dynamics modeling in Vensim, but relevant to any modeling endeavor:

  • Know why you’re building the model.
    • If you’re targeting a presentation or paper, write the skeleton first, so you know how the model will fill in the answers as you go.
  • Organize your data first.
    • No data? No problem. But surely you have some reference mode in mind, and some constraints on behavior, at least in extreme conditions.
    • In Vensim, dump it all into a spreadsheet, database, or text file and import it into a data model, using the Model>Import data… feature, GET XLS DATA functions, or ODBC.
    • Don’t put data in lookups (table functions) unless you must for some technical reason; they’re a hassle to edit and update, and lousy at distinguishing real data points from interpolation.
  • Keep a lab notebook. An open word processor while you work is useful. Write down hypotheses before you run, so that you won’t rationalize surprises. Continue reading “Good modeling practices”

Another Look at Limits to Growth

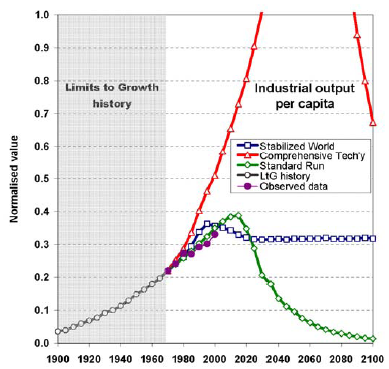
I was just trying to decide whether I believed what I said recently, that the current economic crisis is difficult to attribute to environmental unsustainability. While I was pondering, I ran across this article by Graham Turner on the LtG wiki entry, which formally compares the original Limits runs to history over the last 30+ years. A sample:

Industrial output in Limits to Growth runs vs. history

The report basically finds what I’ve argued before: that history does not discredit Limits.

Setting Up Vensim

I’m trying to adapt to the new tabbed interface in Office 2007. So far, all those pretty buttons seem like a hindrance. Vensim, on the other hand, is a bit too austere. I’ve just installed version 5.9 (check it out, and while you’re at it see the new Ventana site); my setup follows. Note that this only applies to advanced versions of Vensim.

First, I allow the equation editor to “accept enter” – I like to be able to add line breaks to equations (and hate accidentally dismissing the editor with an <enter>). You can do this anyway with <ctl><enter>, but I prefer it this way.

vensim1.png

Continue reading “Setting Up Vensim”

Writing an SD Conference Paper

It’s review time for SD conference papers again. As usual, there’s a lot of variance in quality: really good stuff, stuff that isn’t SD, and good ideas imprisoned in a bad presentation. A few thoughts on how to write a good conference paper, in no particular order:

  • Read a bunch of good SD papers, by browsing the SD Review, Dynamica, Desert Island Dynamics, or past conference plenary papers. You could do a lot worse than picking one as a model for your paper.
  • Start with: What’s the question? Why do we care? Who’s the audience? How will they be influenced? What is their prevailing mental model, and how must it change for things to improve? (If your paper is a methods paper, not a model paper, perhaps the relevant questions are different, but it’s still nice to know why I’m reading something up front.)
  • If you have a model,
    • Make sure units balance, stocks and flows are conserved, structure is robust in extreme conditions, and other good practices are followed. When in doubt, refer to Industrial Dynamics or Business Dynamics.
    • Provide a high-level diagram.
    • Describe what’s endogenous, what’s exogenous, and what’s excluded.
    • Provide some basic stats – What’s the time horizon? How many state variables are there?
    • Provide some data on the phenomena in question, or at least reference modes and a dynamic hypothesis.
    • Discuss validation – how do we know your model is any good?
    • Discuss “Which Policy Run is Best, and Who Says So?” (See DID for the reference).
    • Provide the model in supplementary material, if at all possible.
    • Use intelligible and directional variable names.
    • Clearly identify the parameter changes used to generate each run.
    • Change only one thing at a time in your simulation experiments (or more generally, use scientific method).
    • Explore uncertainty.
    • If your output shows interesting dynamics (or weird discontinuities and other artifacts), please explain.
    • Most importantly, clearly explain why things are happening by relating behavior to structure. Black-box output is boring. Causal loop diagrams or simplified stock-flow schematics may be helpful for explaining the structure of interest.
  • If you use CLDs, Read Problems with Causal Loop Diagrams and Guidelines for Drawing Causal Loop Diagrams and Chapter 5 of Business Dynamics.
  • Archetypes are a compact way to communicate a story, but don’t assume that everyone knows them all. Don’t shoehorn your problem into an archetype; if it doesn’t fit, describe the structure/behavior in its own right.
  • If you present graphs, label axes with units, clearly identify each series, etc. Follow general good practice for statistical graphics. I like lots of graphs because they’re information-rich, but each one should have a clear purpose and association with the text. Screenshots straight out of some modeling packages are not presentation-quality in my opinion.
  • I don’t think it’s always necessary to follow the standard scientific journal article format, it could even be boring, but when in doubt it’s not a bad start.
  • If your English is not the best (perhaps even if it is), at least seek help editing your abstract, so that it’s clear and succinct.
  • Ask yourself whether your paper is really about system dynamics. If you have a model, is it dynamic? Is it behavioral? Does it employ an operational description of the system under consideration? If you’re describing a method, is it applicable to (possibly nonlinear) dynamic systems? If you’re describing a process (group modeling, for example), does it involve decision making or inquiry into a dynamic system? I welcome cross-disciplinary papers, but I think pure OR papers (say, optimizing a shop-floor layout) belong at OR conferences.
  • Do a literature search, especially of the SD Review and SD bibliography, but also of literature outside the field, so that you can explain how the model/method relates to past work in SD and to different perspectives elsewhere. Usually it’s not necessary to report all the gory details of other papers though.
  • Can’t think of a topic? Replicate a classic SD model or a model from another field and critique it. See Christian Erik Kampmann, “Replication and revision of a classic system dynamics model: Critique of ‘Population Control Mechanisms’ System Dynamics Review 7(2), 1991. Or try this.
  • Rejected anyway? Don’t feel bad. Try again next year!

If your kids are boring, you're doing it wrong

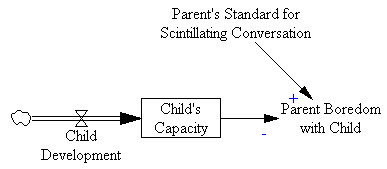
The other day I ran across a blog post (undeserving of a link, though there is a certain voyeuristic fascination to be had in reading it) that described children as boring little wretches, unsuited to inhabit the cerebral stratosphere of their elders. The mental model seemed to be something like the following:

Bad parenting mental model

The policy response to the misfortune of having children implied by the above is to foist them off on TV and day care until they grow up enough that you can tolerate their presence. That leaves you plenty of time for more intellectual pursuits, like tweeting, or speculating about the romance of the person in the next cubicle.

This reminded me of an earlier perspective on children, now thankfully less prevalent:

Their Hearts naturally, are a meer nest, root, fountain of Sin, and wickedness; an evil Treasure from whence proceed evil things viz. Evil Thoughts. Murders, Adulteries &c. Indeed, as sharers in the guilt of Adam’s first Sin, they’re Children of Wrath by Nature, liable to Eternal Vengeance, the Unquencheable Flames of Hell. – Benjamin Wadsworth

Untitled, Ansel Fiddaman, Pastel

Continue reading “If your kids are boring, you're doing it wrong”

SD on Long Waves, Boom & Bust

Two relevant conversations from the SD email list archive:

Where are we in the long wave?

Bill Harris asks, in 2003,

… should a reasonable person think we are now in the down side of a long wave? That the tough economic times we’ve seen for the past few years will need years to work through, as levels adjust? That simple, short-term economic fixes wont work as they may have in the past? That the concerns we’ve heard about deflation should be seen in a longer context of an entire cycle, not as an isolated event to be overcome? Is there a commonly accepted date for the start of this decline?

Was Bill 5 years ahead of schedule?

Preventing the next boom and bust

Kim Warren asks, in 2001,

This is a puzzle – we take a large fraction of the very brightest and best educated people in the world, put them through 2 years of further intensive education in how business, finance and economics are supposed to work, set them to work in big consulting firms, VCs, and investment banks, pay them highly and supervise them with very experienced and equally bright managers. Yet still we manage to invent quite implausible business ideas, project unsustainable earnings and market performance, and divert huge sums of money and talented people from useful activity into a collective fantasy. Some important questions remain unanswered, like who they are, what they did, how they got away with it, and why the rest of us meekly went along with them? So the challenge to SDers in business is … where is the next bubble coming from, what will it look like, and how can we stop it?

Clearly this is one nut we haven’t cracked.

The Blood-Hungry Spleen

OK, I’ve stolen another title, this time from a favorite kids’ book. This post is really about the thyroid, which is a little less catchy than the spleen.

Your hormones are exciting!
They stir your body up.
They’re made by glands (called endocrine)
and give your body pluck.

Allan Wolf & Greg Clarke, The Blood-Hungry Spleen

A friend has been diagnosed with hypothyroidism, so I did some digging on the workings of the thyroid. A few hours searching citations on PubMed, Medline and google gave me enough material to create this diagram:
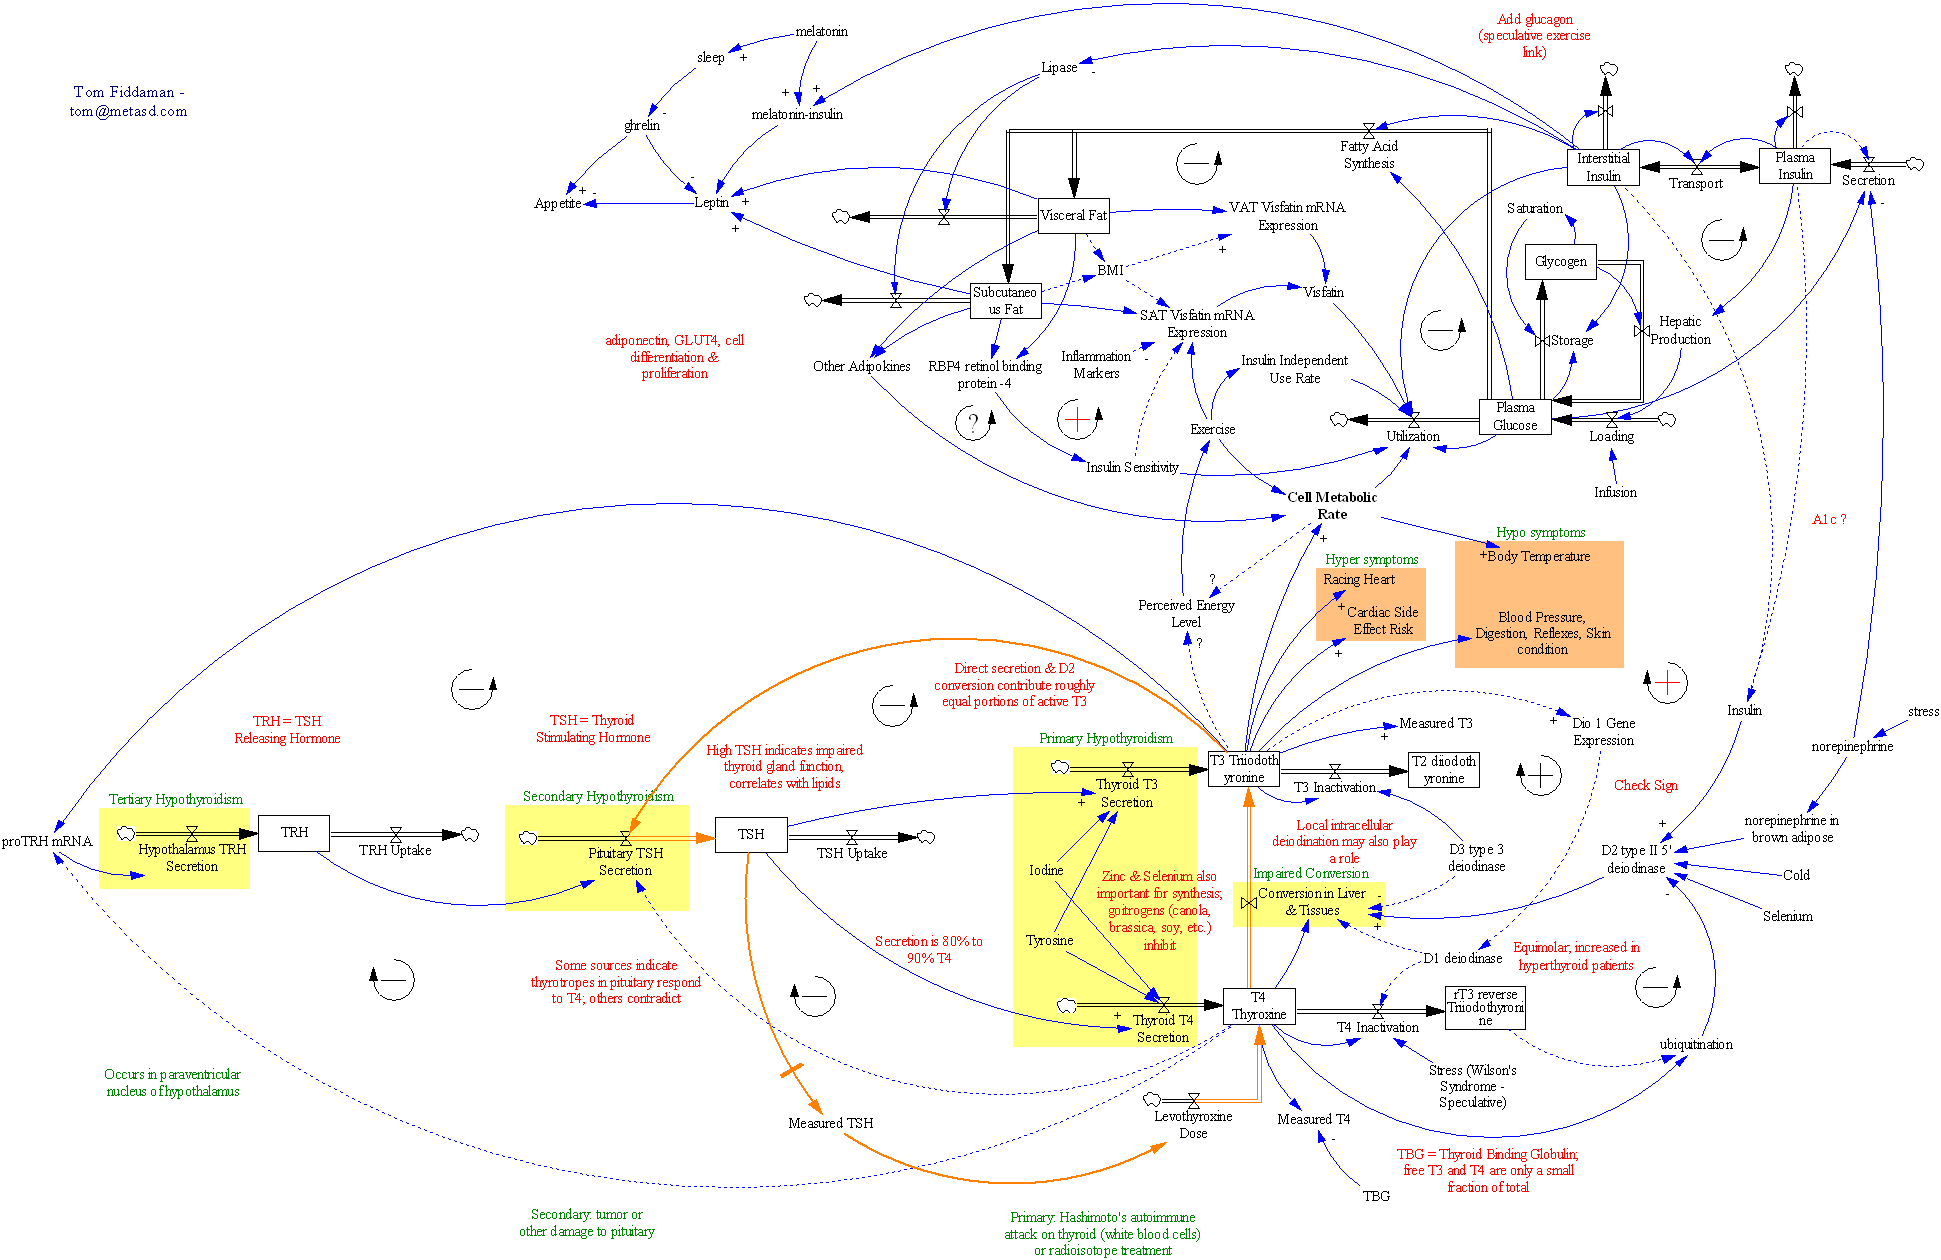
Thyroid function and some associated feedbacks

(This is a LARGE image, so click through and zoom in to do it justice.)

The bottom half is the thyroid control system, as it is typically described. The top half strays into the insulin regulation system (borrowed from a classic SD model), body fat regulation, and other areas that seem related. A lot of the causal links above are speculative, and I have little hope of turning the diagram into a running model. Unfortunately, I can’t find anything in the literature that really digs into the dynamics of the system. In fact, I can’t even find the basics – how much stuff is in each stock, and how long does it stay there? There is a core of the system that I hope to get running at some point though:
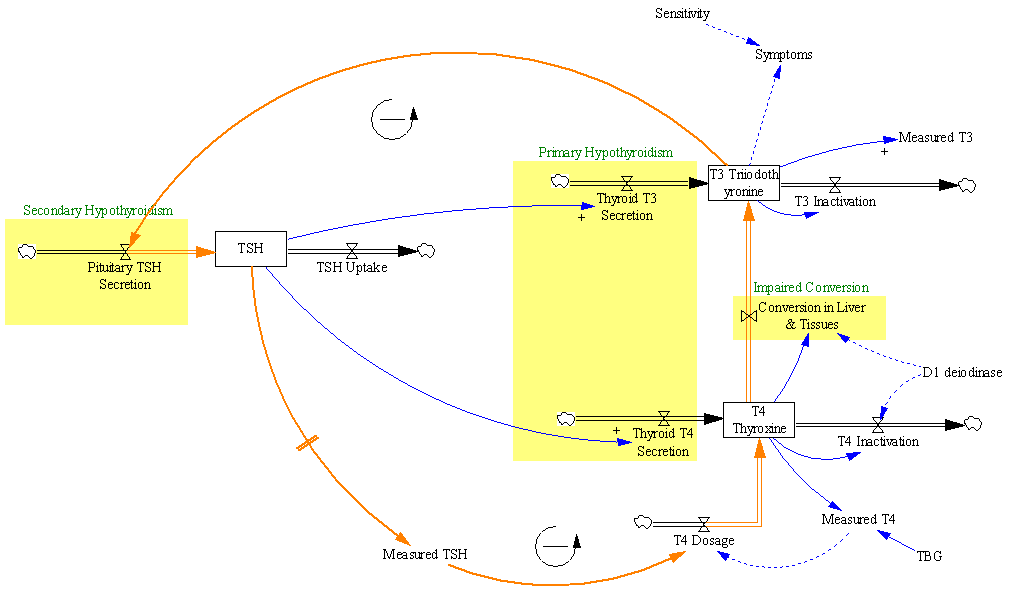
Thyroid - core regulation and dose titration

(another largish image)

This is the part of the system that’s typically involved in the treatment of hypothyroidism with synthetic hormone replacements. Normally, the body runs a negative feedback loop in which thyroid hormone levels (T3/T4) govern production of TSH, which in turn controls the production of T3 and T4. The problem begins when something (perhaps an autoimmune disease, i.e. Hashimoto’s) diminishes the thyroid’s ability to produce T3 and T4 (reducing the two inflows in the big yellow box at center). Then therapy seeks to replace the natural control loop, by adjusting a dose of synthetic T4 (levothyroxine) until the measured level of TSH (left stock structure) reaches a desired target.

This is a negative feedback loop with fairly long delays, so dosage adjustments are made only at infrequent intervals, in order to allow the system to settle between changes. Otherwise, you’d have the aggressive shower taker problem: water’s to cold, crank up the hot water … ouch, too hot, turn it way down … eek, too cold …. Measurements of T3 and T4 are made, but seldom paid much heed – the TSH level is regarded as the “gold standard.”

This black box approach to control is probably effective for many patients, but it leaves me feeling uneasy about several things. The “normal” range for TSH varies by an order of magnitude; what basis is there for choosing one or the other end of the range as a target? Wouldn’t we expect variation among patients in the appropriate target level? How do we know that TSH levels are a reliable indicator, if they don’t correlate well with T3/T4 levels or symptoms? Are extremely sparse measurements of TSH really robust to variability on various time scales, or is dose titration vulnerable to noise?

One could imagine alternative approaches to control, using direct measurements of T3 and T4, or indirect measurements (symptoms). Those might have the advantage of less delay (fewer confounding states between the goal state and the measured state). But T3/T4 measurements seem to be regarded as unreliable, which might have something to do with the fact that it’s hard to find any information on the scale or dynamics of their reservoirs. Symptoms also take a back seat; one paper even demonstrates fairly convincingly that dosage changes +/- 25% have no effect on symptoms (so why are we doing this again?).

I’d like to have a more systemic understanding of both the internal dynamics of the thyroid regulation system, and its interaction with symptoms, behaviors, and other regulatory systems. Here’s hoping that one of you lurkers (I know you’re out there) can comment with some thoughts or references.


So the spleen doesn’t feel shortchanged, I’ll leave you with another favorite:

Lovely
I think that I ain’t never seen
A poem ugly as a spleen.
A poem that could make you shiver
Like 3.5 … pounds of liver.
A poem to make you lose your lunch,
Tie your intestines in a bunch.
A poem all gray, wet, and swollen,
Like a stomach or a colon.
Something like your kidney, lung,
Pancreas, bladder, even tongue.
Why you turning green, good buddy?
It’s just human body study.

John Scieszka & Lane Smith, Science Verse