Randomness in System Dynamics

A discrete event simulation guru asked Ventana colleague David Peterson about the representation of randomness in System Dynamics models. In the discrete event world, granular randomness is the whole game, and it often doesn’t make sense to look at something without doing a lot of Monte Carlo experiments, because any single run could be misleading. The reply:

  • Randomness 1:  System Dynamics models often incorporate random components, in two ways:
    • Internal:  the system itself is stochastic (e.g. parts failures, random variations in sales, Poisson arrivals, etc.
    • External:  All the usual Monte-Carlo explorations of uncertainty from either internal randomness or via replacing constant-but-unknown parameters with probability distributions as a form of sensitivity analysis.
  • Randomness 2:  There is also a kind of probabilistic flavor to the deterministic simulations in System Dynamics.  If one has a stochastic linear differential equation with deterministic coefficients and Gaussian exogenous inputs, it is easy to prove that all the state variables have time-varying Gaussian densities.  Further, the time-trajectories of the means of those Gaussian process can be computed immediately by the deterministic linear differential equation which is just the original stochastic equations, with all random inputs replaced by their mean trajectories.  In System Dynamics, this concept, rigorous in the linear case, is extended informally to the nonlinear case as an approximation.  That is, the deterministic solution of a System Dynamics model is often taken as an approximation of what would be concluded about the mean of a Monte-Carlo exploration.  Of course it is only an approximate notion, and it gives no information at all about the variances of the stochastic variables.
  • Randomness 3:  A third kind of randomness in System Dynamics models is also a bit informal:  delays, which might be naturally modeled as stochastic, are modeled as deterministic but distributed.  For example, if procurement orders are received on average 6 months later, with randomness of an unspecified nature, a typical System Dynamics model would represent the procurement delay as a deterministic subsystem, usually a first- or third-order exponential delay.  That is the output of the delay, in response to a pulse input, is a first- or third-order Erlang shape.  These exponential delays often do a good job of matching data taken from high-volume stochastic processes.
  • Randomness 4:  The Vensim software includes extended Kalman filtering to jointly process a model and data, to estimate the most likely time trajectories of the mean and variance/covariance of the state variables of the model. Vensim also includes the Schweppe algorithm for using such extended filters to compute maximum-likelihood estimates of parameters and their variances and covariances.  The system itself might be completely deterministic, but the state and/or parameters are uncertain trajectories or constants, with the uncertainty coming from a stochastic system, or unspecified model approximations, or measurement errors, or all three.

“Vanilla” SD starts with #2 and #3. That seems weird to people used to the pervasive randomness of discrete event simulation, but has a huge advantage of making it easy to understand what’s going on in the model, because there is no obscuring noise. As soon as things are nonlinear or non-Gaussian enough, or variance matters, you’re into the explicit representation of stochastic processes. But even then, I find it easier to build and debug  a model deterministically, and then turn on randomness. We explicitly reserve time for this in most projects, but interestingly, in top-down strategic environments, it’s the demand that lags. Clients are used to point predictions and take a while to get into the Monte Carlo mindset (forget about stochastic processes within simulations). The financial crisis seems to have increased interest in exploring uncertainty though.

Project Power Laws

An interesting paper finds a heavy-tailed (power law) distribution in IT project performance.

IT projects fall in to a similar category. Calculating the risk associated with an IT project using the average cost overrun is like creating building standards using the average size of earthquakes. Both are bound to be inadequate.

These dangers have yet to be fully appreciated, warn Flyvbjerg and Budzier. “IT projects are now so big, and they touch so many aspects of an organization, that they pose a singular new risk….They have sunk whole corporations. Even cities and nations are in peril.”

They point to the IT problems with Hong Kong’s new airport in the late 1990s, which reportedly cost the local economy some $600 million.

They conclude that it’s only a matter of time before something much more dramatic occurs. “It will be no surprise if a large, established company fails in the coming years because of an out-of-control IT project. In fact, the data suggest that one or more will,” predict Flyvbjerg and Budzier.

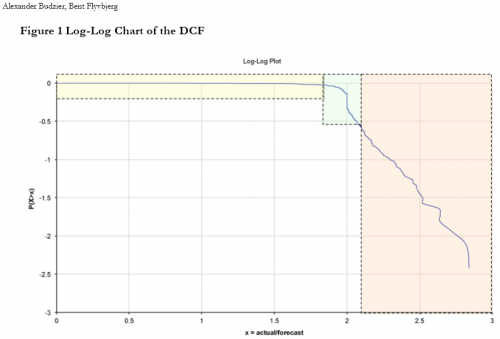
In a related paper, they identify the distribution of project outcomes:

We argue that these results show that project performance up to the first tipping point is politically motivated and project performance above the second tipping point indicates that project managers and decision – makers are fooled by random outliers, …

I’m not sure I buy the detailed interpretation of the political (yellow) and performance (green) regions, but it’s really the right tail (orange) that’s of interest. The probability of becoming a black swan is 17%, with mean 197% cost increase, 68% schedule increase, and some outcomes much worse.

The paper discusses some generating mechanisms for power law distributions (highly optimized tolerance, preferential attachment, …). A simple recipe for power laws is to start with some benign variation or heterogeneity, and add positive feedback. Voila – power laws on one or both tails.

What I think is missing in the discussion is some model of how a project actually works. This of course has been a staple of SD for a long time. And SD shows that projects and project portfolios are chock full of positive feedback: the rework cycle, Brooks’ Law, congestion, dilution, burnout, despair.

It would be an interesting experiment to take an SD project or project portfolio model and run some sensitivity experiments to see what kind of tail you get in response to light-tailed inputs (normal or uniform).

Circling the Drain

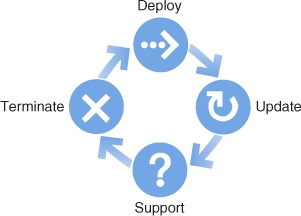
“It’s Time to Retire ‘Crap Circles’,” argues Gardiner Morse in the HBR. I wholeheartedly agree. He’s assembled a lovely collection of examples. Some violate causality amusingly:

“Through some trick of causality, termination leads to deployment.”

Morse ridicules one diagram that actually shows an important process,

The friendly-looking sunburst that follows, captured from the website of a solar energy advocacy group, shows how to create an unlimited market for your product. Here, as the supply of solar energy increases, so does the demand — in an apparently endless cycle. If these folks are right, we’re all in the wrong business.

This is not a particularly well-executed diagram, but the positive feedback process (reinforcing loop) of increasing demand driving economies of scale, lowering costs and further increasing demand, is real. Obviously there are other negative loops that restrain this one from delivering infinite solar, but not every diagram needs to show every loop in a system.

Unfortunately, Morse’s prescription, “We could all benefit from a little more linear thinking,” is nearly as alarming as the illness. The vacuous linear processes are right there next to the cycles in PowerPoint’s Smart Art:

Linear thinking isn’t a get-out-of-chartjunk-free card. It’s an invitation to event-driven unidirectional causal thinking, laundry lists, and George Richardson’s Dead Buffalo Syndrome. What we really need is more understanding of causality and feedback, and more operational thinking, so that people draw meaningful graphics, employing cycles where they appropriately describe causality.

h/t John Sterman for pointing this out.

Defense Against the Black Box

Baseline Scenario has a nice account of the role of Excel in the London Whale (aka Voldemort) blowup.

… To summarize: JPMorgan’s Chief Investment Office needed a new value-at-risk (VaR) model for the synthetic credit portfolio (the one that blew up) and assigned a quantitative whiz (“a London-based quantitative expert, mathematician and model developer” who previously worked at a company that built analytical models) to create it. The new model “operated through a series of Excel spreadsheets, which had to be completed manually, by a process of copying and pasting data from one spreadsheet to another.” The internal Model Review Group identified this problem as well as a few others, but approved the model, while saying that it should be automated and another significant flaw should be fixed. After the London Whale trade blew up, the Model Review Group discovered that the model had not been automated and found several other errors. Most spectacularly,

“After subtracting the old rate from the new rate, the spreadsheet divided by their sum instead of their average, as the modeler had intended. This error likely had the effect of muting volatility by a factor of two and of lowering the VaR . . .”

Microsoft Excel is one of the greatest, most powerful, most important software applications of all time. …

As a consequence, Excel is everywhere you look in the business world—especially in areas where people are adding up numbers a lot, like marketing, business development, sales, and, yes, finance. …

But while Excel the program is reasonably robust, the spreadsheets that people create with Excel are incredibly fragile. There is no way to trace where your data come from, there’s no audit trail (so you can overtype numbers and not know it), and there’s no easy way to test spreadsheets, for starters. The biggest problem is that anyone can create Excel spreadsheets—badly. Because it’s so easy to use, the creation of even important spreadsheets is not restricted to people who understand programming and do it in a methodical, well-documented way.

This is why the JPMorgan VaR model is the rule, not the exception: manual data entry, manual copy-and-paste, and formula errors. This is another important reason why you should pause whenever you hear that banks’ quantitative experts are smarter than Einstein, or that sophisticated risk management technology can protect banks from blowing up. …

System Dynamics has a strong tradition of model quality control, dating all the way back to its origins in Industrial Dynamics. Some of it is embodied in software, while other bits are merely habits and traditions. If the London Whale model had been an SD model, would the crucial VaR error have occurred? Since the model might not have employed much feedback, one might also ask, had it been built with SD software, like Vensim, would the error have occurred?

There are multiple lines of defense against model errors:

  • Seeing the numbers. This is Excel’s strong suit. It apparently didn’t help in this case though.
  • Separation of model and data. A model is a structure that one can populate with different sets of parameters and data. In Excel, the structure and the data are intermingled, so it’s tough to avoid accidental replacement of structure (an equation) by data (a number), and tough to compare versions of models or model runs to recover differences. Vensim is pretty good at that. But it’s not clear that such comparisons would have revealed the VaR structure error.
  • Checking units of measure. When I was a TA for the MIT SD course, I graded a LOT of student models. I think units checking would have caught about a third of conceptual errors. In this case though, the sum and average of a variable have the same units, so it wouldn’t have helped.
  • Fit to data. Generally, people rely far too much on R^2, and too little on other quality checks, but the VaR error is exactly the kind of problem that might be revealed by comparison to history. However, if the trade was novel, there might not be any relevant data to use. In any case, there’s no real obstacle to evaluating fit in Excel, though the general difficulties of building time series models are an issue where time is relevant.
  • Conservation laws. SD practitioners are generally encouraged to observe conservation of people, money, material, etc. Software supports this with the graphical stock-flow convention, though it ought to be possible to do more. Excel doesn’t provide any help in this department, though it’s not clear whether it would have mattered to the Whale trade model.
  • Extreme conditions tests. “Kicking the tires” of models has been a good idea since the beginning. This is an ingrained SD habit, and Vensim provides Reality Check™ to automate it. It’s not clear that this would have revealed the VaR sum vs. average error, because that’s a matter of numerical sensitivity that might not reveal itself as a noticeable change in behavior. But I bet it would reveal lots of other problems with the model boundary and limitations to validity of relationships.
  • Abstraction. System Dynamics focuses on variables as containers for time series, and distinguishes stocks (state variables) from flows and other auxiliary conversions. Most SD languages also include some kind of array facility, like subscripts in Vensim, for declarative processing of detail complexity. Excel basically lacks such conventions, except for named ranges that are infrequently used. Time and other dimensions exist spatially as row-column layout. This means that an Excel model is full of a lot of extraneous material for handling dynamics, is stuck in discrete time, can’t be checked for DT stability, and requires a lot of manual row-column fill operations to express temporal phenomena that are trivial in SD and many other languages. With less busywork needed, it might have been much easier for auditors to discover the VaR error.
  • Readable equations. It’s not uncommon to encounter =E1*EXP($D$3)*SUM(B32:K32)^2/(1+COUNT(A32:K32)) in Excel. While it’s possible to create such gobbledygook in Vensim, it’s rare to actually encounter it, because SD software and habits encourage meaningful variable names and “chunking” equations into comprehensible components. Again, this might have made it much easier for auditors to discover the VaR error.
  • Graphical representation of structure. JPMorgan should get some credit for having a model audit process at all, even though it failed to prevent the error. Auditors’ work is much easier when they can see what the heck is going on in the model. SD software provides useful graphical conventions for revealing model structure. Excel has no graphics. There’s an audit tool, but it’s hampered by the lack of a variable concept, and it’s slower to use than Vensim’s Causal Tracing™.

I think the score’s Forrester 8, Gates 1. Excel is great for light data processing and presentation, but it’s way down my list of tools to choose for serious modeling. The secret to its success, cell-level processing that’s easy to learn and adaptable to many problems, is also its Achilles heel. Add in some agency problems and confirmation bias, and it’s a deadly combination:

There’s another factor at work here. What if the error had gone the wrong way, and the model had incorrectly doubled its estimate of volatility? Then VaR would have been higher, the CIO wouldn’t have been allowed to place such large bets, and the quants would have inspected the model to see what was going on. That kind of error would have been caught. Errors that lower VaR, allowing traders to increase their bets, are the ones that slip through the cracks. That one-sided incentive structure means that we should expect VaR to be systematically underestimated—but since we don’t know the frequency or the size of the errors, we have no idea of how much.

Sadly, the loss on this single trade would probably just about pay for all the commercial SD that’s ever been done.

Related:

The Trouble with Spreadsheets

Fuzzy VISION

Positive feedback drives email list meltdown

I’m on an obscure email list for a statistical downscaling model. I think I’ve gotten about 10 messages in the last two years. But today, that changed.

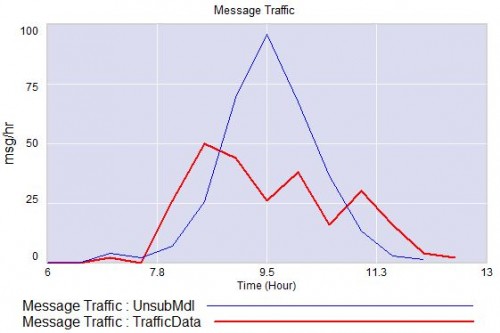
List traffic (data in red).

Around 7 am, there were a couple of innocuous, topical messages. That prompted someone who’d evidently long forgotten about the list to send an “unsubscribe me” message to the whole list. (Why people can’t figure out that such missives are both ineffective and poor list etiquette is beyond me.) That unleashed a latent vicious cycle: monkey-see, monkey-do produced a few more “unsub” messages. Soon the traffic level became obnoxious, spawning more and more ineffectual unsubs. Then, the brakes kicked in, as more sensible users appealed to people to quit replying to the whole list. Those messages were largely lost in the sea of useless unsubs, and contributed to the overall impression that things were out of control.

People got testy:

I will reply to all to make my point.

Has it occurred to any of you idiots to just reply to Xxxx Xxxx rather than hitting reply to all. Come on already, this is not rocket science here. One person made the mistake and then you all continue to repeat it.

By about 11, the fire was slowing, evidently having run out of fuel (list ignoramuses), and someone probably shut it down by noon – but not before at least a hundred unsubs had flown by.

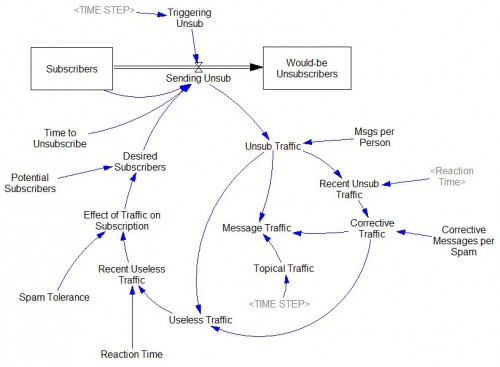
Just for kicks, I counted the messages and put together a rough-cut Vensim model of this little boom-bust cycle:

unsub.mdl unsub.vpm

This is essentially the same structure as the Bass Diffusion model, with a few refinements. I think I didn’t quite capture the unsubscriber behavior. Here, I assume that would-be unsubscribers, who think they’ve left the list but haven’t, at least quit sending messages. In reality, they didn’t – in blissful ignorance of what was going on, several sent multiple requests to be unsubscribed. I didn’t explicitly represent the braking effect (if any) of corrective comments. Also, the time constants for corrections and unsubscriptions could probably be separated. But it has the basics – a positive feedback loop driving growth in messages, and a negative feedback loop putting an end to the growth. Anyway, have fun with it.

Computing and networks have solved a lot of problems, like making logistics pipelines visible, but they’ve created as many new ones. The need for models to improve intuition and manage new problems is as great as ever.

A Geoff Coyle reading list

The System Dynamics Society reports that SD pioneer Geoff Coyle has passed away.

We report the sad news that longtime system dynamicist R. Geoffrey Coyle died on November 19, 2012. Geoff was 74. He started his career as a mining engineer. Having completed a PhD in Operations Research, he came to Cambridge, Massachusetts from the UK in the late 1960’s, and studied with Jay Forrester to learn system dynamics. Upon his return to the UK, he started to develop system dynamics in England. He was the founder of the first system dynamics group in the UK, at the University of Bradford in 1970. This group grew terrifically and produced some of the most important people in our field. Geoff and his students have made enormously important contributions to the field and the next generation of their students have as well, all following in Geoff’s footsteps and under his tutelage.

Geoff and the Bradford group also founded the first system dynamics journal, Dynamica. They created DYSMAP, the first system dynamics software that had built-in optimization and built-in dimensional consistency technique.

Geoff authored a number of very important books in the field including: Management in System Dynamics (1977), System Dynamics Modelling: A Practical Approach (1996) and Practical Strategy: Tools and Techniques (2004). In 1998, he was the first recipient of the Lifetime Achievement Award of the System Dynamics Society. More recently he returned to his first academic love and wrote a highly acclaimed history of mining in the UK: The riches beneath our feet (2010). This is a wonderful legacy in the field of system dynamics and beyond.

I realized that, while I’ve always enjoyed his irascibly interesting presentations, I’ve only read a few of his works. So, I’ve collected a Coyle reading list: Continue reading “A Geoff Coyle reading list”

Not even wrong: a school board’s discussion of systems thinking

Socialism. Communism. “Nazism.” American Exceptionalism. Indoctrination. Buddhism. Meditation. “Americanism.” These are not words or terms one would typically expect to hear in a Winston-Salem/Forsyth County School Board meeting. But in the Board’s last meeting on October 9th, they peppered the statements of public commenters and Board Members alike.

The object of this invective? Systems thinking. You really have to read part 1 and part 2 of Camel City Dispatch’s article to get an appreciation for the school board’s discussion of the matter.

I know that, as a systems thinker, I should look for the unstated assumptions that led board members to their critiques, and establish a constructive dialog. But I just can’t do it – I have to call out the fools. While there are some voices of reason, several of the board members and commenters apparently have no understanding of the terms they bandy about, and have no business being involved in the education of anyone, particularly children.

The low point of the exchange:

Jeannie Metcalf said she “will never support anything that has to do with Peter Senge… I don’t care what [the teachers currently trained in System’s Thinking] are teaching. I don’t care what lessons they are doing. He’s is trying to sell a product. Once it insidiously makes its way into our school system, who knows what he’s going to do. Who knows what he’s going to do to carry out his Buddhist way of thinking and his hatred of Capitalism. I know y’all are gonna be thinkin’ I’m a crazy person, but I’ve been around a long time.”

Yep, you’re crazy all right. In your imaginary parallel universe, “hatred of capitalism” must be a synonym for writing one of the most acclaimed business books ever, sitting at one of the best business schools in the world, and consulting at the highest levels of many Fortune 50 companies.

The common thread among the ST critics appears to be a total failure to actually observe classrooms combined with shoot-the-messenger reasoning from consequences. They see, or imagine, a conclusion that they don’t like, something that appears vaguely environmental or socialist, and assume that it must be part of the hidden agenda of the curriculum. In fact, as supporters pointed out, ST is a method, which could as easily be applied to illustrate the benefits of individualism, markets, or whatnot, as long as they are logically consistent. Of course, if one’s pet virtue has limits or nuances, ST may also reveal those – particularly when simulation is used to formalize arguments. That is what the critics are really afraid of.

Kon-Tiki & the STEM workforce

I don’t know if Thor Heyerdahl had Polynesian origins or Rapa Nui right, but he did nail the stovepiping of thinking in organizations:

“And there’s another thing,” I went on.
“Yes,” said he. “Your way of approaching the problem. They’re specialists, the whole lot of them, and they don’t believe in a method of work which cuts into every field of science from botany to archaeology. They limit their own scope in order to be able to dig in the depths with more concentration for details. Modern research demands that every special branch shall dig in its own hole. It’s not usual for anyone to sort out what comes up out of the holes and try to put it all together.

Carl was right. But to solve the problems of the Pacific without throwing light on them from all sides was, it seemed to me, like doing a puzzle and only using the pieces of one color.

Thor Heyerdahl, Kon-Tiki

This reminds me of a few of my consulting experiences, in which large firms’ departments jealously guarded their data, making global understanding or optimization impossible.

This is also common in public policy domains. There’s typically an abundance of micro research that doesn’t add up to much, because no one has bothered to build the corresponding macro theory, or to target the micro work at the questions you need to answer to build an integrative model.

An example: I’ve been working on STEM workforce issues – for DOE five years ago, and lately for another agency. There are a few integrated models of workforce dynamics – we built several, the BHEF has one, and I’ve heard of efforts at several aerospace firms and agencies like NIH and NASA. But the vast majority of education research we’ve been able to find is either macro correlation studies (not much causal theory, hard to operationalize for decision making) or micro examination of a zillion factors, some of which must really matter, but in a piecemeal approach that makes them impossible to integrate.

An integrated model needs three things: what, how, and why. The “what” is the state of the system – stocks of students, workers, teachers, etc. in each part of the system. Typically this is readily available – Census, NSF and AAAS do a good job of curating such data. The “how” is the flows that change the state. There’s not as much data on this, but at least there’s good tracking of graduation rates in various fields, and the flows actually integrate to the stocks. Outside the educational system, it’s tough to understand the matrix of flows among fields and economic sectors, and surprisingly difficult even to get decent measurements of attrition from a single organization’s personnel records. The glaring omission is the “why” – the decision points that govern the aggregate flows. Why do kids drop out of science? What attracts engineers to government service, or the finance sector, or leads them to retire at a given age? I’m sure there are lots of researchers who know a lot about these questions in small spheres, but there’s almost nothing about the “why” questions that’s usable in an integrated model.

I think the current situation is a result of practicality rather than a fundamental philosophical preference for analysis over synthesis. It’s just easier to create, fund and execute standalone micro research than it is to build integrated models.

The bad news is that vast amounts of detailed knowledge goes to waste because it can’t be put into a framework that supports better decisions. The good news is that, for people who are inclined to tackle big problems with integrated models, there’s lots of material to work with and a high return to answering the key questions in a way that informs policy.

In search of SD conference excellence

I was pleasantly surprised by the quality of presentations I attended at the SD conference in St. Gallen. Many of the posters were also very good – the society seems to have been successful in overcoming the booby-prize stigma, making it a pleasure to graze on the often-excellent work in a compact format (if only the hors d’oeuvre line had had brevity to match its tastiness…).

In anticipation of an even better array of papers next year, here’s my quasi-annual reminder about resources for producing good work in SD:

I suppose I should add posts on good presentation technique and poster development (thoughts welcome).

Thanks to the organizers for a well-run enterprise in a pleasant venue.

The Capen Quiz at the System Dynamics Conference

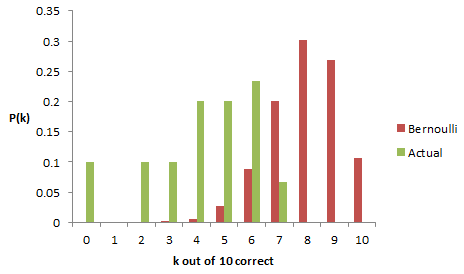
I ran my updated Capen quiz at the beginning of my Vensim mini-course on optimization and uncertainty at the System Dynamics conference. The results were pretty typical – people expressed confidence bounds that were too narrow compared to their actual knowledge of the questions. Thus their effective confidence was at the 40% level rather than the 80% level desired. Here’s the distribution of actual scores from about 30 people, compared to a Binomial (10,.8) distribution:

(I’m going from memory here on the actual distribution, because I forgot to grab the flipchart of results. Did anyone take a picture? I won’t trouble you with my confidence bounds on the the confidence bounds.)

My take on this is that it’s simply very hard to be well-calibrated intuitively, unless you dedicate time for explicit contemplation of uncertainty. But it is a learnable skill – my kids, who had taken the original Capen quiz, managed to score 7 out of 10.

Even if you can get calibrated on a set of independent questions, real-world problems where dimensions covary are really tough to handle intuitively. This is yet another example of why you need a model.