Elk, wolves and dynamic system visualization

Bret Victor’s video of a slick iPad app for interactive visualization of the Lotka-Voltera equations has been making the rounds:

Coincidentally, this came to my notice around the same time that I got interested in the debate over wolf reintroduction here in Montana. Even simple models say interesting things about wolf-elk dynamics, which I’ll write about some other time (I need to get vaccinated for rabies first).

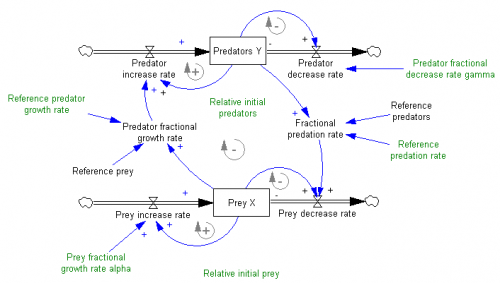
To ponder the implications of the video and predator-prey dynamics, I built a version of the Lotka-Voltera model in Vensim.

After a second look at the video, I still think it’s excellent. Victor’s two design principles, ubiquitous visualization and in-context manipulation, are powerful for communicating a model. Some aspects of what’s shown have been in Vensim since the introduction of SyntheSim a few years ago, though with less Tufte/iPad sexiness. But other features, like Causal Tracing, are not so easily discovered – they’re effective for pros, but not new users. The way controls appear at one’s fingertips in the iPad app is very elegant. The “sweep” mode is also clever, so I implemented a similar approach (randomized initial conditions across an array dimension) in my version of the model. My favorite trick, though, is the 2D control of initial conditions via the phase diagram, which makes discovery of the system’s equilibrium easy.

The slickness of the video has led some to wonder whether existing SD tools are dinosaurs. From a design standpoint, I’d agree in some respects, but I think SD has also developed many practices – only partially embodied in tools – that address learning gaps that aren’t directly tackled by the app in the video: Continue reading “Elk, wolves and dynamic system visualization”

Lotka-Volterra predator-prey system

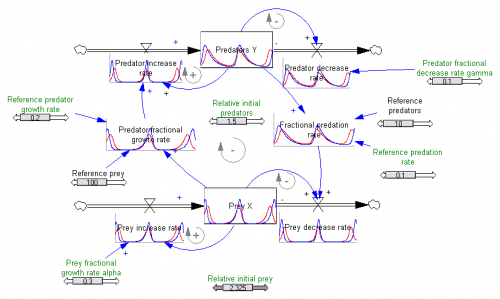
The Lotka-Volterra equations, which describe a predator-prey system, must be one of the more famous dynamic systems. There are many generalizations and applications outside of biology.

Wikipedia has a nice article, which I used as the basis for this simple model.

Continue reading “Lotka-Volterra predator-prey system”

Path Dependence, Competition, and Succession in the Dynamics of Scientific Revolution

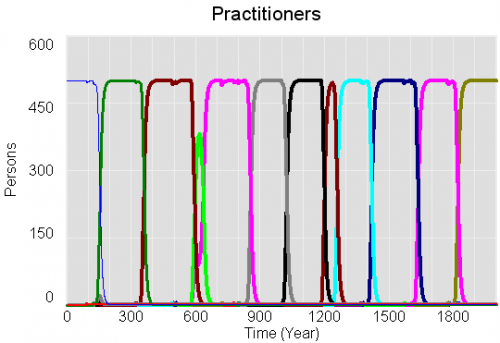
This is a very interesting model, both because it tackles ‘soft’ dynamics of paradigm formation in ‘hard’ science, and because it is an aggregate approach to an agent problem. Unfortunately, until now, the model was only available in DYNAMO, which limited access severely. It turns out to be fairly easy to translate to Vensim using the dyn2ven utility, once you know how to map the DYNAMO array FOR loops to Vensim subscripts.

Path Dependence, Competition, and Succession in the Dynamics of Scientific Revolution

J. Wittenberg and J. D. Sterman, 1999

Abstract

What is the relative importance of structural versus contextual forces in the birth and death of scientific theories? We describe a dynamic model of the birth, evolution, and death of scientific paradigms based on Kuhn’s Structure of Scientific Revolutions. The model creates a simulated ecology of interacting paradigms in which the creation of new theories is stochastic and endogenous. The model captures the sociological dynamics of paradigms as they compete against one another for members. Puzzle solving and anomaly recognition are also endogenous. We specify various regression models to examine the role of intrinsic versus contextual factors in determining paradigm success. We find that situational factors attending the birth of a paradigm largely determine its probability of rising to dominance, while the intrinsic explanatory power of a paradigm is only weakly related to the likelihood of success. For those paradigms that do survive the emergence phase, greater explanatory power is significantly related to longevity. However, the relationship between a paradigm’s ‘strength’ and the duration of normal science is also contingent on the competitive environment during the emergence phase. Analysis of the model shows the dynamics of competition and succession among paradigms to be conditioned by many positive feedback loops. These self-reinforcing processes amplify intrinsically unobservable micro-level perturbations in the environment – the local conditions of science, society, and self faced by the creators of a new theory – until they reach macroscopic significance. Such dynamics are the hallmark of self-organizing evolutionary systems.

We consider the implications of these results for the rise and fall of new ideas in contexts outside the natural sciences such as management fads.

Cite as: J. Wittenberg and J. D. Sterman (1999) Path Dependence, Competition, and Succession in the Dynamics of Scientific Revolution. Organization Science, 10.

I believe that this version is faithful to the original, but it’s difficult to be sure because the model is stochastic, so the results differ due to differences in the random number streams. For the moment, this model should be regarded as a beta release.

Continue reading “Path Dependence, Competition, and Succession in the Dynamics of Scientific Revolution”

Polya urn with increasing returns

This set of models performs a variant of a Polya urn experiment, along the lines of that described in Bryan Arthur’s Increasing Returns and Path Dependence in the Economy, Chapter 10. There’s a small difference, which is that samples are drawn with replacement (Bernoulli distribution) rather than without (hypergeometric distribution).

The interesting dynamics arise from competing positive feedback loops through the stocks of red and white balls. There’s useful related reading at http://tuvalu.santafe.edu/~wbarthur/Papers/Papers.html

I did the physical version of this experiment with Legos with my kids:

I tried the Polya urns experiment over lunch. We put 5 red and 5 white legos in a bowl, then took turns drawing a sample of 5. We returned the sample to the bowl, plus one lego of whichever color dominated the sample. Iterate. At the start, and after 2 or 3 rounds, I solicited guesses about what would happen. Gratifyingly, the consensus was that the bowl would remain roughly evenly divided between red and white. After a few more rounds, the reality began to diverge, and we stopped when white had a solid 2:1 advantage. I wondered aloud whether using a larger or smaller sample would lead to faster convergence. With no consensus about the answer, we tried it – drawing samples of just 1 lego. I think the experimental outcome was somewhat inconclusive – we quickly reached dominance of red, but the sampling process was much faster, so it may have actually taken more rounds to achieve that. There’s a lot of variation possible in the outcome, which means that superstitious learning is a possible trap.

This model automates the experiment, which makes it easier and more reliable to explore questions like the sensitivity of the rate of divergence to the sample size.

PolyaUrn.vpm

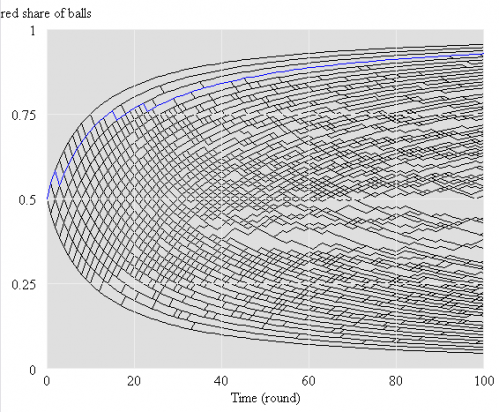
This version works with Vensim PLE (though it’s not supposed to, because it uses the RANDOM BERNOULLI function). It performs a single experiment per run, but includes sensitivity control files for performing hundreds of runs at a time (requires PLE Plus). That makes for a nice map of outcomes:

Continue reading “Polya urn with increasing returns”

A System Zoo

I just picked up a copy of Hartmut Bossel’s excellent System Zoo 1, which I’d seen years ago in German, but only recently discovered in English. This is the first of a series of books on modeling – it covers simple systems (integration, exponential growth and decay), logistic growth and variants, oscillations and chaos, and some interesting engineering systems (heat flow, gliders searching for thermals). These are high quality models, with units that balance, well-documented by the book. Every one I’ve tried runs in Vensim PLE so they’re great for teaching.

I haven’t had a chance to work my way through the System Zoo 2 (natural systems – climate, ecosystems, resources) and System Zoo 3 (economy, society, development), but I’m pretty confident that they’re equally interesting.

You can get the models for all three books, in English, from the Uni Kassel Center for Environmental Systems Research – it’s now easy to find a .zip archive of the zoo models for the whole series, in Vensim .mdl format, on CESR’s home page: www2.cesr.de/downloads.

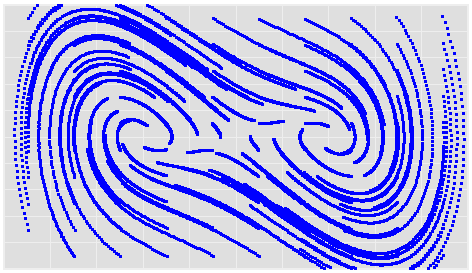
To tantalize you, here are some images of model output from Zoo 1. First, a phase map of a bistable oscillator, which was so interesting that I built one with my kids, using legos and neodymium magnets:

Continue reading “A System Zoo”

Delay Sandbox

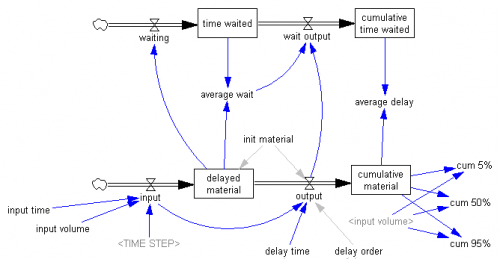
There’s a handy rule of thumb for estimating how much of the input to a first order delay has propagated through as output: after three time constants, 95%. (This is the same as the rule for estimating how much material has left a stock that is decaying exponentially – about a 2/3 after one lifetime, 85% after two, 95% after three, and 99% after five lifetimes.)

I recently wanted rules of thumb for other delay structures (third order or higher), so I built myself a simple model to facilitate playing with delays. It uses Vensim’s DELAY N function, to make it easy to change the delay order.

Here’s the structure:

Continue reading “Delay Sandbox”

Theil Statistics

Source: Created by Rogelio Oliva, 1995; Updated by Tom Fiddaman, 2009 2011 – slight improvement to numerical robustness.

See Sterman, J. D. 1984. Appropriate Summary Statistics for Evaluating the Historical Fit of System Dynamics Models. Dynamica 10 (2): 51-66.

Units balance: Yes

Format: Vensim; requires an advanced version

Files:

D-4584 Theil Statistics documentation– D-memo documentation

Theil_2011.mdl – Theil Statistics model

Theil_2011.vpm – published binary version; includes data.vdf so it’ll run right out of the box

Dummy_data.mdl – dummy data generator creating input to Theil model

Vensim Compiled Simulation on the Mac

Speed freaks on Windows have long had access to 2 to 5x speed improvements from compiled simulations. Now that’s available on the Mac in the latest Vensim release.

Here’s how to do it, in three easy steps:

  • Get a Mac.
  • Get the gcc compiler. The only way I know to get this is to sign up as an Apple Developer (free) and download Xcode (I grabbed 3.2.2, which is much smaller than the 3.2.6+iOS SDK, but version shouldn’t matter much). There may be other ways, but this was easy.
  • Get Vensim DSS. After you install (checking the Install external function and compiled simulation support to: box), launch the program and go to Vensim DSS>Preferences…>Startup and set the Compiled simulation path to /Users/Shared/Vensim/comp. Now move to the advanced tab and set the compilation options to Query or Compile (you may want to skip this for normal Simulation, and just do it for Optimization and Sensitivity, where speed really counts).

OK, so I cheated a little on the step count, but it really is pretty easy. It’s worth it, too: I can run World3 1000 times in about 8 seconds interpreted; compiled gets that down to about 2.

Update: It turns out that an installer bug prevents 5.10d on the Mac from installing a needed file; you can get it here.

The Rise and Fall of the Saturday Evening Post

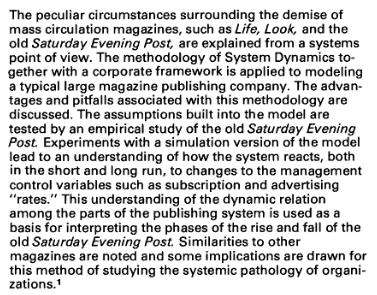
Replicated by David Sirkin and Julio Gomez from Hall, R. I. 1976. A system pathology of an organization: The rise and fall of the old Saturday Evening Post. Administrative Science Quarterly 21(2): 185-211. (JSTOR link). Just updated for newer Vensim versions.

This is one of the classic models on the Desert Island Dynamics list.

There are some units issues, preserved from the original by David and Julio. As I update it, I also wonder if there are some inconsistencies in the accounting for the subscription pipeline. Please report back here if you find anything interesting.

satevepost2011b.mdl

satevepost2011b.vmf

Boiling Water Reactor Dynamics

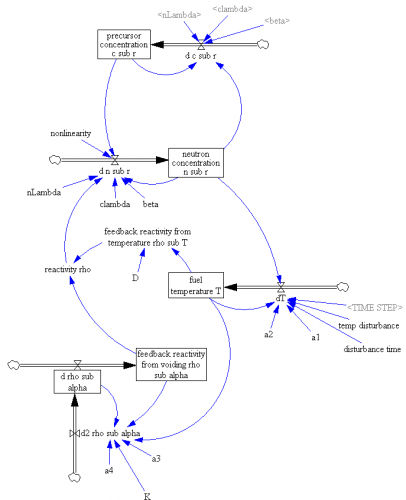
Replicated from “Hybrid Simulation of Boiling Water Reactor Dynamics Using A University Research Reactor” by James A. Turso, Robert M. Edwards, Jose March-Leuba, Nuclear Technology vol. 110, Apr. 1995.

This is a simple 5th-order representation of the operation of a boiling water reactor around its normal operating point, which is subject to interesting limit cycle dynamics.

The original article documents the model well, with the exception of the bifurcation parameter K and a nonlinear term, for which I’ve identified plausible values by experiment.

TursoNuke1.mdl