… until you try to formalize it in a mathematical model.
Fortunately, modeling is also a fast way to learn.

Don't just do something, stand there! Reflections on the counterintuitive behavior of complex systems, seen through the eyes of System Dynamics, Systems Thinking and simulation.
Econbrowser has an interesting article on the Billion Prices Project, which looks for daily price movements on items across the web. This yields a price index that’s free of quality change assumptions, unlike hedonic CPI measures, but introduces some additional issues due to the lack of control over the changing portfolio of measured items.
A couple of years ago we built the analytics behind the RPX index of residential real estate prices, and grappled with many of the same problems. The competition was the CSI – the Case-Shiller indes, which uses the repeat-sales method. With that approach, every house serves as its own control, so changes in neighborhoods or other quality aspects wash out. However, the clever statistical control introduces some additional problems. First, it reduces the sample of viable data points, necessitating a 3x longer reporting lag. Second, the processing steps reduce transparency. Third, one step in particular involves downweighting of homes with (possibly implausibly) large price movements, which may have the side effect of reducing sensitivity to real extreme events. Fourth, users may want to see effects of a changing sales portfolio.
For the RPX, we chose instead a triple power law estimate, ignoring quality and mix issues entirely. The TPL is basically a robust measure of the central tendency of prices. It’s not too different from the median, except that it provides some diagnostics of data quality issues from the distribution of the tails. The payoff is a much more responsive index, which can be reported daily with a short lag. We spent a lot of time comparing the RPX to the CSI, and found that, while changes in quality and mix of sales could matter in principle, in practice the two approaches yield essentially the same answer, even over periods of years. My (biased) inclination, therefore, is to prefer the RPX approach. Your mileage may vary.
One interesting learning for me from the RPX project was that traders don’t want models. We went in thinking that sophisticated dynamics coupled to data would be a winner. Maybe it is a winner, but people want their own sophisticated dynamics. They wanted us to provide only a datastream that maximized robustness and transparency, and minimized lag. Those are sensible design principles. But I have to wonder whether a little dynamic insight would have been useful as well since, after all, many data consumers evidently did not have an adequate model of the housing market.
The Afghanistan counterinsurgency causal loop diagram makes another appearance in this TED talk, in which Eric Berlow shows the hypnotized chickens the light:
https://www.ted.com/talks/eric_berlow_simplifying_complexity/transcript?language=en
I’m of two minds about this talk. I love that it embraces complexity rather than reacting with the knee-jerk “eeewww … gross” espoused by so many NYT commenters. The network view of the system highlights some interesting relationships, particularly when colored by the flavor of each sphere (military, ethnic, religious … ). Also, the generic categorization of variables that are actionable (unlike terrain) is useful. The insights from ecosystem simplification are potentially quite interesting, though we really only get a tantalizing hint at what might lie beneath.
However, I think the fundamental analogy between the system CLD and a food web or other network may only partially hold. That means that the insight, that influence typically lies within a few degrees of connectivity of the concept of interest, may not be generalizable. Generically, a dynamic model is a network of gains among state variables, and there are perhaps some reasons to think that, due to signal attenuation and so forth, that most influences are local. However, there are some important differences between the Afghan CLD and typical network diagrams.
In a food web, the nodes are all similar agents (species) which have a few generic relationships (eat or be eaten) with associated flows of information or resources. In a CLD, the nodes are a varied mix of agents, concepts, and resources. As a result, their interactions may differ wildly: the interaction between “relative popularity of insurgents” and “funding for insurgents” (from the diagram) is qualitatively different from that between “targeted strikes” and “perceived damages.” I suspect that in many models, the important behavior modes are driven by dynamics that span most of the diagram or model. That may be deliberate, because we’d like to construct models that describe a dynamic hypothesis, without a lot of extraneous material.
Probably the best way to confirm or deny my hypothesis would be to look at eigenvalue analysis of existing models. I don’t have time to dig into this, but Kampmann & Oliva’s analysis of Mass’ economic model is an interesting case study. In that model, the dominant structures responsible for oscillatory modes in the economy are a real mixed bag, with important contributions from both short and longish loops.
This bears further thought … please share yours, especially if you have a chance to look at Berlow’s PNAS article on food webs.
Needlessly provocative title notwithstanding, the dairy industry has to be one of the most spectacular illustrations of the battle for control of system leverage points. In yesterday’s NYT:
Domino’s Pizza was hurting early last year. Domestic sales had fallen, and a survey of big pizza chain customers left the company tied for the worst tasting pies.
Then help arrived from an organization called Dairy Management. It teamed up with Domino’s to develop a new line of pizzas with 40 percent more cheese, and proceeded to devise and pay for a $12 million marketing campaign.
Consumers devoured the cheesier pizza, and sales soared by double digits. “This partnership is clearly working,” Brandon Solano, the Domino’s vice president for brand innovation, said in a statement to The New York Times.
But as healthy as this pizza has been for Domino’s, one slice contains as much as two-thirds of a day’s maximum recommended amount of saturated fat, which has been linked to heart disease and is high in calories.
And Dairy Management, which has made cheese its cause, is not a private business consultant. It is a marketing creation of the United States Department of Agriculture — the same agency at the center of a federal anti-obesity drive that discourages over-consumption of some of the very foods Dairy Management is vigorously promoting.
Urged on by government warnings about saturated fat, Americans have been moving toward low-fat milk for decades, leaving a surplus of whole milk and milk fat. Yet the government, through Dairy Management, is engaged in an effort to find ways to get dairy back into Americans’ diets, primarily through cheese.
Now recall Donella Meadows’ list of system leverage points:
Leverage points to intervene in a system (in increasing order of effectiveness)
12. Constants, parameters, numbers (such as subsidies, taxes, standards)
11. The size of buffers and other stabilizing stocks, relative to their flows
10. The structure of material stocks and flows (such as transport network, population age structures)
9. The length of delays, relative to the rate of system changes
8. The strength of negative feedback loops, relative to the effect they are trying to correct against
7. The gain around driving positive feedback loops
6. The structure of information flow (who does and does not have access to what kinds of information)
5. The rules of the system (such as incentives, punishment, constraints)
4. The power to add, change, evolve, or self-organize system structure
3. The goal of the system
2. The mindset or paradigm that the system – its goals, structure, rules, delays, parameters – arises out of
1. The power to transcend paradigms
The dairy industry has become a master at exercising these points, in particular using #4 and #5 to influence #6, resulting in interesting conflicts about #3.
Specifically, Dairy Management is funded by a “checkoff” (effectively a tax) on dairy output. That money basically goes to marketing of dairy products. A fair amount of that is done in stealth mode, through programs and information that appear to be generic nutrition advice, but happen to be funded by the NDC, CNFI, or other arms of Dairy Management. For example, there’s http://www.nutritionexplorations.org/ – for kids, they serve up pizza:

That slice of “combination food” doesn’t look very nutritious to me, especially if it’s from the new Dominos line DM helped create. Notice that it’s cheese pizza, devoid of toppings. And what’s the gratuitous bowl of mac & cheese doing there? Elsewhere, their graphics reweight the food pyramid (already a grotesque product of lobbying science), to give all components equal visual weight. This systematic slanting of nutrition information is a nice example of my first deadly sin of complex system management.
A conspicuous target of dubious dairy information is school nutrition programs. Consider this, from GotMilk:
Flavored milk contributes only small amounts of added sugars to children ‘s diets. Sodas and fruit drinks are the number one source of added sugars in the diets of U.S. children and adolescents, while flavored milk provides only a small fraction (< 2%) of the total added sugars consumed.
It’s tough to fact-check this, because the citation doesn’t match the journal. But it seems likely that the statement that flavored milk provides only a small fraction of sugars is a red herring, i.e. that it arises because flavored milk is a small share of intake, rather than because the marginal contribution of sugar per unit flavored milk is small. Much of the rest of the information provided is a similar riot of conflated correlation and causation and dairy-sponsored research. I have to wonder whether innovations like flavored milk are helpful, because they displace sugary soda, or just one more trip around a big eroding goals loop that results in kids who won’t eat anything without sugar in it.
Elsewhere in the dairy system, there are price supports for producers at one end of the supply chain. At the consumer end, their are price ceilings, meant to preserve the affordability of dairy products. It’s unclear what this bizarre system of incentives at cross-purposes really delivers, other than confusion.
The fundamental problem, I think, is that there’s no transparency: no immediate feedback from eating patterns to health outcomes, and little visibility of the convoluted system of rules and subsidies. That leaves marketers and politicians free to push whatever they want.
So, how to close the loop? Unfortunately, many eaters appear to be uninterested in closing the loop themselves by actively seeking unbiased information, or even actively resist information contrary to their current patterns as the product of some kind of conspiracy. That leaves only natural selection to close the loop. Not wanting to experience that personally, I implemented my own negative feedback loop. I bought a cholesterol meter and modified my diet until I routinely tested OK. Sadly, that meant no more dairy.
It looks like public interest in the stimulus has a two to three month time constant.
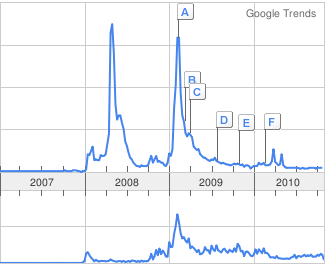 That’s interesting, because it takes much longer than three months for the stimulus to take effect. It also seems that news media (bottom trace) have slightly more durable interest than the public (searches, top trace), which is not what they’re normally accused of.
Jay Forrester’s 1971 Counter Intuitive Behavior of Social Systems sums up this election pretty well for me.
… social systems are inherently insensitive to most policy changes that people choose in an effort to alter the behavior of systems. In fact, social systems draw attention to the very points at which an attempt to intervene will fail. Human intuition develops from exposure to simple systems. In simple systems, the cause of a trouble is close in both time and space to symptoms of the trouble. If one touches a hot stove, the burn occurs here and now; the cause is obvious. However, in complex dynamic systems, causes are often far removed in both time and space from the symptoms. True causes may lie far back in time and arise from an entirely different part of the system from when and where the symptoms occur. However, the complex system can mislead in devious ways by presenting an apparent cause that meets the expectations derived from simple systems. A person will observe what appear to be causes that lie close to the symptoms in both time and space—shortly before in time and close to the symptoms. However, the apparent causes are usually coincident occurrences that, like the trouble symptom itself, are being produced by the feedback-loop dynamics of a larger system.
Translation: economy collapses under a Republican administration. Democrats fail to fix it, partly for lack of knowledge of correct action but primarily because it’s unfixable on a two-year time scale. Voters who elected the Dems by a large margin forget the origins of the problem, become dissatisfied and throw the bums out, but replace them with more clueless bums.
… social systems seem to have a few sensitive influence points through which behavior can be changed. These high-influence points are not where most people expect. Furthermore, when a high-influence policy is identified, the chances are great that a person guided by intuition and judgment will alter the system in the wrong direction.
Translation: everyone suddenly becomes a deficit hawk at the worst possible time, even though they don’t know whether Obama is a Keynesian.
The root of the problem:
Mental models are fuzzy, incomplete, and imprecisely stated. Furthermore, within a single individual, mental models change with time, even during the flow of a single conversation. The human mind assembles a few relationships to fit the context of a discussion. As debate shifts, so do the mental models. Even when only a single topic is being discussed, each participant in a conversation employs a different mental model to interpret the subject. Fundamental assumptions differ but are never brought into the open. Goals are different but left unstated.
It is little wonder that compromise takes so long. And even when consensus is reached, the underlying assumptions may be fallacies that lead to laws and programs that fail.
Still,
… there is hope. It is now possible to gain a better understanding of dynamic behavior in social systems. Progress will be slow. There are many cross-currents in the social sciences which will cause confusion and delay. … If we proceed expeditiously but thoughtfully, there is a basis for optimism.
From the WaPo:
[Obama] also virtually abandoned his legislation – hopelessly stalled in the Senate – featuring economic incentives to reduce carbon emissions from power plants, vehicles and other sources.
“I’m going to be looking for other means of addressing this problem,” he said. “Cap and trade was just one way of skinning the cat,” he said, strongly implying there will be others.
In the campaign, Republicans slammed the bill as a “national energy tax” and jobs killer, and numerous Democrats sought to emphasize their opposition to the measure during their own re-election races.
Well, maybe a little, but it doesn’t help.
From time to time we at Ventana encounter consulting engagements where the problem space is already occupied by other models. Typically, these are big, detailed models from academic or national lab teams who’ve been working on them for a long time. For example, in an aerospace project we ran into detailed point-to-point trip generation models and airspace management simulations with every known airport and aircraft in them. They were good, but cumbersome and expensive to run. Our job was to take a top-down look at the big picture, integrating the knowledge from the big but narrow models. At first there was a lot of resistance to our intrusion, because we consumed some of the budget, until it became evident that the existence of the top-down model added value to the bottom-up models by placing them in context, making their results more relevant. The benefit was mutual, because the bottom-up models provided grounding for our model that otherwise would have been very difficult to establish. I can’t quite say that we became one big happy family, but we certainly developed a productive working relationship.
I think situations involving complementary models are more common than head-to-head competition among models that serve the same purpose. Even where head-to-head competition does exist, it’s healthy to have multiple models, especially if they embody different methods. (The trouble with global climate policy is that we have many models that mostly embody the same general equilibrium assumptions, and thus differ only in detail.) Rather than getting into methodological pissing matches, modelers should be seeking the synergy among their efforts and making it known to decision makers. That helps to grow the pie for all modeling efforts, and produces better decisions.
Certainly there are exceptions. I once ran across a competing vendor doing marketing science for a big consumer products company. We were baffled by the high R^2 values they were reporting (.92 to .98), so we reverse engineered their model from the data and some slides (easy, because it was a linear regression). It turned out that the great fits were due to the use of 52 independent parameters to capture seasonal variation on a weekly basis. Since there were only 3 years of data (i.e. 3 points per parameter), we dubbed that the “variance eraser.” Replacing the 52 parameters with a few targeted at holidays and broad variations resulted in more realistic fits, and also revealed problems with inverted signs (presumably due to collinearity) and other typical pathologies. That model deserved to be displaced. Still, we learned something from it: when we looked cross-sectionally at several variants for different products, we discovered that coefficients describing the sales response to advertising were dependent on the scale of the product line, consistent with our prior assertion that effects of marketing and other activities were multiplicative, not additive.
The reality is that the need for models is almost unlimited. The physical sciences are fairly well formalized, but models span a discouragingly small fraction of the scope of human behavior and institutions. We need to get the cost of providing insight down, not restrict the supply through infighting. The real enemy is seldom other models, but rather superstition, guesswork and propaganda.
I ran across a nice interpretation of Paul Krugman’s comments on China’s monetary policy. It’s also a great example of the limitations of verbal descriptions of complex feedbacks:
In order to invest in China you need state permission and the state limits how much money comes in. It essentially has an import quota on Yuan.
This means that while Yuan are loose in the international market and therefore cheap, they are actually tight at home and therefore expensive. Because China is controlling the flow on money across the border it can have a loose international monetary policy but a tight domestic monetary policy.
Indeed, it goes deeper than that. A loose international Yuan bids up foreign demand for Chinese goods. This in turn both increase the quantity of goods China produces and their domestic price. Essentially, foreign consumers are given a price advantage relative to domestic consumers.
However, China doesn’t want domestic consumers to face higher prices. So, it has to tighten the domestic Yuan even tighter. It has too push down domestic demand so that the sum of international demand plus domestic demand are not so high that they produce domestic inflation.
The tight domestic Yuan, therefore, is driving down Chinese consumption at precisely the time in which the world could use more consumption. The loose international Yuan also gives foreigners a price advantage when buying Chinese goods and so it is driving down inflation in the US at precisely the time the Fed is trying to dive it up.
However, the story still gets worse from there – I am really riffing here, half of this is just occurring to me as I type. The loose international Yuan can only be used to produce manufactured goods. Manufacturing requires commodities both as the feed stock for the actual goods and to be used in the construction of new manufacturing facilities.
What does that mean. It should mean that when the Fed loosens policy, that China responds by loosening the International Yuan which in turn gets shunted towards commodities. Thus rather than boosting the consumer price level as we hope, Fed easing actually winds up boosting commodities.
This is because China is offsetting the total increase in worldwide consumer demand by tightening the Yuan at home, and boosting the total increase in commodity demand by loosening the Yuan abroad.
If this is a bit baffling, it helps to get the context from the originals. Still, it begs for a model or at least a diagram. At least the punch line is simple:
Thus this Yuan policy does all the wrong things.
Meanwhile, in a bizarre parallel universe where climate policy exists in a vacuum, China calls the US a preening pig. Couldn’t they at least wait for Palin to be elected? Seriously, US climate policy is a joke, but Chinese monetary-industrial policy is just as destructive.
I find that many great thinkers are systems thinkers, even if they don’t use the lingo of feedback. Here’s a great example, in which Ben Franklin anticipates the American revolution, describing forces that could bring it about:
TO THE COMMITTEE OF CORRESPONDENCE IN MASSACHUSETTS
London, May 15, 1771.
GENTLEMEN,
I have received your favour of the 27th of February, with the journal of the House of Representatives, and copies of the late oppressive prosecutions in the Admiralty Court, which I shall, as you direct, communicate to Mr. Bollan, and consult with him on the most advantageous use to be made of them for the interest of the province.
I think one may clearly see, in the system of customs [import taxes] to be exacted in America by act of Parliament, the seeds sown of a total disunion of the two countries, though, as yet, that event may be at a considerable distance. The course and natural progress seems to be, first, the appointment of needy men as officers, for others do not care to leave England; then, their necessities make them rapacious, their office makes them proud and insolent, their insolence and rapacity make them odious, and, being conscious that they are hated, they become malicious; their malice urges them to a continual abuse of the inhabitants in their letters to administration, representing them as disaffected and rebellious, and (to encourage the use of severity) as weak, divided, timid, and cowardly. Government believes all; thinks it necessary to support and countenance its officers; their quarrelling with the people is deemed a mark and consequence of their fidelity; they are therefore more highly rewarded, and this makes their conduct still more insolent and provoking.
The resentment of the people will, at times and on particular incidents, burst into outrages and violence upon such officers, and this naturally draws down severity and acts of further oppression from hence. The more the people are dissatisfied, the more rigor will be thought necessary; severe punishments will be inflicted to terrify; rights and privileges will be abolished; greater force will then be required to secure execution and submission; the expense will become enormous; it will then be thought proper, by fresh exactions, to make the people defray it; thence, the British nation and government will become odious, the subjection to it will be deemed no longer tolerable; war ensues, and the bloody struggle will end in absolute slavery to America, or ruin to Britain by the loss of her colonies; the latter most probable, from America’s growing strength and magnitude.
….
I do not pretend to the gift of prophecy. History shows, that, by these steps, great empires have crumbled heretofore; and the late transactions we have so much cause to complain of show, that we are in the same train, and that, without a greater share of prudence and wisdom, than we have seen both sides to be possessed of, we shall probably come to the same conclusion….
With great esteem and respect, I have the honour to be, &c.
B. FRANKLIN.
This translates readily into a rich causal loop diagram (click the image to enlarge):
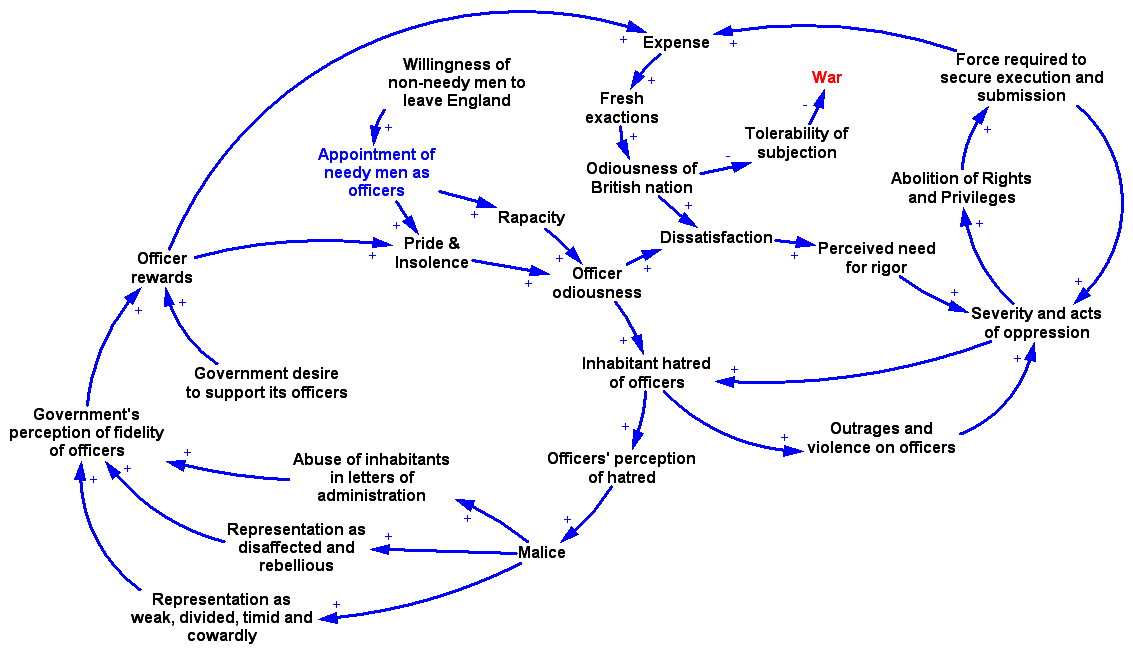
My CLD here is basically a direct translation of the letter. That makes it sound a little more like a cycle of events, and less like interaction of quantities that can vary, than I would like. I think it could be refined somewhat by aggregating related concepts and rearranging a few links. For example, war is really just an escalation of violence, so one could simplify by treating the level of violence more generically.
The interesting thing about this diagram is that it’s all positive loops. Presumably the “prudence and wisdom” that Franklin noted would have created negative loops that would have stabilized the situation. What were they?
I bet a lot of the same dynamics are in the DOD Afghanistan counterinsurgency diagram.
Thanks to Dan Proctor for the original letter & idea.
The Vensim CLD is here if you want to play: franklin.mdl