The Trouble with Spreadsheets

As a prelude to my next look at alternative fuels models, some thoughts on spreadsheets.

Everyone loves to hate spreadsheets, and it’s especially easy to hate Excel 2007 for rearranging the interface: a productivity-killer with no discernible benefit. At the same time, everyone uses them. Magne Myrtveit wonders, Why is the spreadsheet so popular when it is so bad?

Spreadsheets are convenient modeling tools, particularly where substantial data is involved, because numerical inputs and outputs are immediately visible and relationships can be created flexibly. However, flexibility and visibility quickly become problematic when more complex models are involved, because:

  • Structure is invisible and equations, using row-column addresses rather than variable names, are sometimes incomprehensible.
  • Dynamics are difficult to represent; only Euler integration is practical, and propagating dynamic equations over rows and columns is tedious and error-prone.
  • Without matrix subscripting, array operations are hard to identify, because they are implemented through the geography of a worksheet.
  • Arrays with more than two or three dimensions are difficult to work with (row, column, sheet, then what?).
  • Data and model are mixed, so that it is easy to inadvertently modify a parameter and save changes, and then later be unable to easily recover the differences between versions. It’s also easy to break the chain of causality by accidentally replacing an equation with a number.
  • Implementation of scenario and sensitivity analysis requires proliferation of spreadsheets or cumbersome macros and add-in tools.
  • Execution is slow for large models.
  • Adherence to good modeling practices like dimensional consistency is impossible to formally verify

For some of the reasons above, auditing the equations of even a modestly complex spreadsheet is an arduous task. That means spreadsheets hardly ever get audited, which contributes to many of them being lousy. (An add-in tool called Exposé can get you out of that pickle to some extent.)

There are, of course, some benefits: spreadsheets are ubiquitous and many people know how to use them. They have pretty formatting and support a wide variety of data input and output. They support many analysis tools, especially with add-ins.

For my own purposes, I generally restrict spreadsheets to data pre- and post-processing. I do almost everything else in Vensim or a programming language. Even seemingly trivial models are better in Vensim, mainly because it’s easier to avoid unit errors, and more fun to do sensitivity analysis with Synthesim.

Lorenz Attractor

This is an implementation of Lorenz’ groundbreaking model that exhibits continuous-time chaos.

A google search turns up lots of good information on this model. For more advanced material, try google scholar.

I didn’t replicate this from Lorenz’ original 1963 article, Deterministic Nonperiodic Flow, but you can find a copy here.

Updated!

lorenz2.vmf

lorenz2.vpm

Logistic Chaos

This is an implementation of the logistic model – a very simple example of discrete time chaotic behavior. It’s sometimes used to illustrate chaotic dynamics of insect populations.

There’s a nice description here, and the other top links on google tend to be good.

Note that this version corrects an equation error in previous versions.

Logistic (Vensim .vpm)

Logistic (Vensim .vmf)

LCFS in Equilibrium II

My last post introduced some observations from simulation of an equilibrium fuel portfolio standard model:

  • knife-edge behavior of market volume of alternative fuels as you approach compliance limits (discussed last year): as the required portfolio performance approaches the performance of the best component options, demand for those approaches 100% of volume rapidly.
  • differences in the competitive landscape for technology providers, when compared to alternatives like a carbon tax.
  • differences in behavior under uncertainty.
  • perverse behavior when the elasticity of substitution among fuels is low

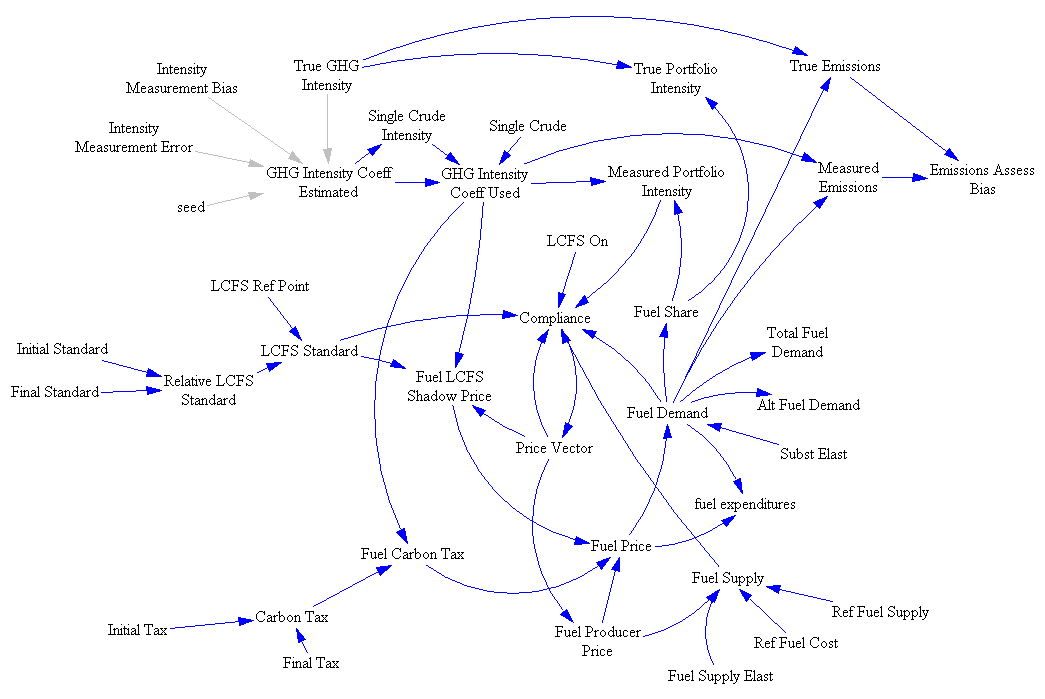
Here are some of the details. First, the model:

structure

Notice that this is not a normal SD model – there are loops but no stocks. That’s because this is a system of simultaneous equations solved in equilibrium. The Vensim FIND ZERO function is used to find a vector of prices (one for each fuel, plus the shadow price of emissions intensity) that matches supply and demand, subject to the intensity constraint.

Continue reading “LCFS in Equilibrium II”

Heat Trap

Replicated by: Tom Fiddaman

Citation: Hatlebakk, Magnus, & Moxnes, Erling (1992). Misperceptions and Mismanagement of the Greenhouse Effect? The Simulation Model . Report # CMR-92-A30009, December). Christian Michelsen Research.

Units: no

Format: Vensim

This is a climate-economy model, of about the same scale and vintage as Nordhaus’ original DICE model. It’s more interesting in some respects, because it includes path-dependent reversible and irreversible emissions reductions. As I recall, the original also had some stochastic elements, not active here. This version has no units; hopefully I can get an improved version online at some point.

Heat trap (Vensim .vmf)

World3 Population Sector

Population sector extracted from the World3 model.

Documented in Dynamics of Growth in a Finite World, by Dennis L. Meadows, William W. Behrens III, Donella H. Meadows, Roger F. Naill, Jorgen Randers, and Erich K.O. Zahn. 1974 ISBN 0-9600294-4-3 . See also Limits to Growth, The 30-Year Update, by Dennis Meadows and Eric Tapley. ISBN 1-931498-85-7 .

See my article at The other bathtubs – population

World3-Population (Vensim .vpm)

World3-Population (Vensim .mdl)

World3-Population (Vensim .vmf)

Ultradian Oscillations of Insulin and Glucose

Citation: Jeppe Sturis, Kenneth S. Polonsky, Erik Mokilde, and Eve van Cauter. Computer Model for Mechanisms Underlying Ultradian Oscillations of Insulin and Glucose. Am. J. Physiol. 260 (Endocrinol. Metab. 23): E801-E809, 1991.

Source: Replicated by Hank Taylor

Units: No Yes!

Format: Vensim

Ultradian Oscillations of Insulin and Glucose (Vensim .vpm)

Update, 10/2017:

Refreshed, with units defined (mathematically the same as before): ultradia2.vpm ultradia2.mdl

Further refined, for initialization in equilibrium (insulin by analytic expression; glucose by parameter). Glucose infusion turned on by default. Graphs added.

ultradia-enhanced-3.mdl ultradia-enhanced-3.vpm

Sea Level Rise

Citations: Rahmstorf 2007, “A semi-empirical approach to projecting future sea level rise.” Science 315. Grinsted, Moore & Jevrejeva 2009. “Reconstructing sea level from paleo and projected temperatures 200 to 2100 AD.” Climate Dynamics [1]

Source: Replicated by Tom Fiddaman based on an earlier replication of Rahmstorf provided by John Sterman

Units balance: Yes

Format: Vensim; requires Model Reader or an advanced version

Notes: See discussion at metasd.

Files:

Grinsted_v3b‎ – first model; default calibration replicates Rahmstorf, and optimization is set up to adjust constant terms to fit Rahmstorf slope to data

Grinsted_v3c‎ – second model; updated data and calibration, as in Part III

Grinsted_v3c-k2‎ – third model; set up for Kalman filtering, as in Part V