Month: August 2008
Sustainable WalMart?
Today at Balaton I heard from Hunter Lovins about WalMart’s sustainability efforts. It’s tempting to question their motives and the likely outcome, but there’s enough going on that EDF is creating a presence in Bentonville. As of today, sustainability features prominently on WalMart’s home page. It’s hard to get excited about their Love, Earth jewelry line, but some of their other activities could have a significant impact. They have some very interesting initiatives, like product labeling for green content based on life cycle analysis (learning from Patagonia).
A few quick reflections:
WalMart’s traditional focus has been cost-saving efficiencies. That can take place through two paths: genuine innovation (good) and pushing costs off on society as externalities (pollution, social consequences of labor policy, etc. – bad). If WalMart’s sustainability efforts represent calling off the latter, that’s a good thing. However, as long as institutions and consumer preferences don’t support verification of such efforts in general, it makes WalMart susceptible to competitors with fewer scruples.
Historically, WalMart’s efforts to outrun its competitors and squeeze value out of its supply chain reduce diversity and enhance its market power. That means we have fewer experiments (and resources) with which to explore ideas – a classic case of optimization of a complex system for a single purpose that inadvertently makes it fragile in changing conditions.
It’s easy to see how dematerializing the supply chain is helpful. As material constraints increasingly become important, the same efficiencies that currently are frequently consumed by rebound effects could become a vehicle for the delivery of greater good per scarce megawatt, TonC, or bushel. However, there’s a second key component of greening the world, which is simply consuming less. It’s easy to see how a cutting edge company can make money selling greener products. It’s not so easy for me to see how a company is going to make money from people trading fewer goods and services for more leisure time or other non-market activity.
This suggests three priorities:
- Encourage propagation of this idea, so that brown suppliers dumped by WalMart aren’t simply scooped up by Kmart.
- Help chains to think more deeply about supply chain diversity and how procurement and social practices contribute to resilience.
- Keep working on the underlying drivers of consumption growth.
Climate War Game – Recap
I presented a brief review of my involvement in the CNAS wargame at Balaton today. My last few slides focus on some observations from the game. They led to a very interesting conversation about targets for future models and games. We have been planning to continue seeking ways to insert models into negotiations, with the goal of connecting individual parties’ positions to aggregate global outcomes. However, in the conversation we identified a much more ambitious goal: reframing the whole negotiation process.
The fundamental problem, in the war game and the real world, is that nations are stuck in a lose-lose paradigm: who will bear the burden of costly mitigation? No one is willing to forego growth, as long as “growth is good” is an unqualified mantra. What negotiations need is a combination of realization that growth founded on externalizing costs of pollution and depletion isn’t really good, and that fixing the institutional and behavioral factors that would unleash large low- or negative-cost emissions reductions and cobenefits would be a win-win. That, combined with a serious and equitable accounting of climate impacts within the scope of present activities and coupling of adaptation and development opportunities to mitigation could tilt the landscape in favor of a meaningful agreement.
Ethics, Equity & Models
I’m at the 2008 Balaton Group meeting, where a unique confluence of modeling talent, philosophy, history, activist know-how, compassion and thirst for sustainability makes it hard to go 5 minutes without having a Big Idea.
Our premeeting tackled Ethics, Values, and the Next Generation of Energy and Climate Modeling. I presented a primer on discounting and welfare in integrated assessment modeling, based on a document I wrote for last year’s meeting, translating some of the issues raised by the Stern Review and critiques into plainer language. Along the way, I kept a running list of assumptions in models and modeling processes that have ethical/equity implications.
There are three broad insights:
- Technical choices in models have ethical implications. For example, choices about the representation of technology and resource constraints determine whether a model explores a parameter space where “growing to help the poor” is a good idea or not.
- Modelers’ prescriptive and descriptive uses of discounting and other explicit choices with ethical implications are often not clearly distinguished.
- Decision makers have no clue how the items above influence model outcomes, and do not in any case operate at that level of description.
My list of ethical issues is long and somewhat overlapping. Perhaps in part that is due to the fact that I compiled it with no clear definition of ‘ethics’ in mind. However, I think it’s also due to the fact that there are inevitably large gray areas in practice, accentuated by the fact that the issue doesn’t receive much formal attention. Here goes: Continue reading “Ethics, Equity & Models”
Regional Climate Initiatives – Model Roll Call – Part II
Minnesota
The Minnesota Next Generation Energy Act establishes a goal of reducing GHG emissions by 15% by 2015, 30% by 2025, and 80% by 2050, relative to 2005 levels.
From ScienceDaily comes news of a new research report from University of Minnesota’s Center fro Transportation Studies. The study looks at options for reducing transport emissions. Interestingly, transport represents 24% of MN emissions, vs. more than 40% in CA. The study decomposes emissions according to a variant of the IPAT identity,
Emissions = (Fuel/VehicleMile) x (Carbon/Fuel) x (VehicleMilesTraveled)
Vehicle and fuel effects are then modeled with LEAP, an energy modeling platform with a fast-growing following. The VMT portion is tackled with a spreadsheet calculator from CCAP’s Guidebook. I haven’t had much time to examine the latter, but it considers a rich set of options and looks like at least a useful repository of data. However, it’s a static framework, and land use-transportation interactions are highly dynamic. I’d expect it to be a useful way to construct alternative transport system visions, but not much help determining how to get there from here.
Minnesota’s Climate Change Advisory Group TWG on land use and transportation has a draft inventory and forecast of emissions. The Energy Supply and Residential/Commercial/Industrial TWGs developed spreadsheet analyses of a number of options. Analysis and Assumptions memos describe the results, but the spreadsheets are not online.
British Columbia
OK, it’s not a US region, but maybe we could trade it for North Dakota. BC has a revenue-neutral carbon tax, supplemented by a number of other initiatives. The tax starts at $10/TonCO2 and rises $5/year to $30 by 2012. The tax is offset by low-income tax credits and 2 to 5% reductions in lower income tax brackets; business tax reductions match personal tax reductions in roughly a 1:2 ratio.
BC’s Climate Action Plan includes a quantitative analysis of proposed policies, based on the CIMS model. CIMS is a detailed energy model coupled to a macroeconomic module that generates energy service demands. CIMS sounds a lot like DOE’s NEMS, which means that it could be useful for determining near-term effects of policies with some detail. However, it’s probably way too big to modify quickly to try out-of-the-box ideas, estimate parameters by calibration against history, or perform Monte Carlo simulations to appreciate the uncertainty around an answer.
The BC tax demonstrates a huge advantage of a carbon tax over cap & trade: it can be implemented quickly. The tax was introduced in the Feb. 19 budget, and switched on July 1st. By contrast, the WCI and California cap & trade systems have been underway much longer, and still are no where near going live. The EU ETS was authorized in 2003, turned on in 2005, and still isn’t dialed in (plus it has narrower sector coverage). Why so fast? It’s simple – there’s no trading infrastructure to design, no price uncertainty to worry about, and no wrangling over allowance allocations (though the flip side of the last point is that there’s also no transient compensation for carbon-intensive industries).
Bizarrely, BC wants to mess everything up by layering cap & trade on top of the carbon tax, coordinated with the WCI (in which BC is a partner).
Climate War Game – China's Position
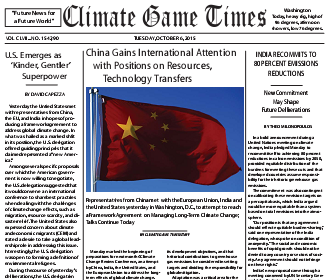
Given its large global presence in 2015, by any measure, China’s posture in the negotiations was critical. The Climate Game Times reported:
China put forth a set of principles yesterday that will guide today’s continued negotiations on migration, disaster relief, resource scarcity, and emissions reductions…. These principles included statements that China’s efforts in these areas will be consistent with its development objectives, and that historical contributions to greenhouse gas emissions be considered in setting targets and dividing the responsibility for global mitigation.
…
In perhaps the most important detail to emerge from yesterday’s negotiations, the China team will continue to lead in pushing for technology transfers for mitigation and adaptation measures, particularly in emissions reductions, in land use and forestry, and in agriculture so as to encourage a new ‘green revolution.’
I spent much of my time sitting in on the China team’s deliberations. The discussion was very realistic when viewed in the light of 2008 developing country positions, but I began to wonder whether that position could lead to a good outcome for the people of China. Some underlying assumptions that trouble me:
Google News, Trends, Insight
I’ve found trends on Google news interesting for some time. For example, did net news predict a housing bubble?

As online sources of such social data get richer, and control and normalization issues are solved or at least made transparent, they could become a useful input to behavioral models. Already, I find them to be a useful reality check, for seeing how long it takes for events to show up on popular radar, and whether things that seem big are really big in the public mind.
Visual Geology
A cool portal for worldwide geological map information has just been launched. OneGeology is a portal, into which regional geologic survey agencies can link their data through a map interface. Users can access map info through a web interface akin to Google Maps. Regional and global layers can be added easily, as in a GIS tool. Here’s a map of rock age for Afghanistan, overlayed on NASA Modis imagery, generated in just a minute or two:
Climate War Game – In Pictures
Two quick visualizations of the scenario data behind the war game:
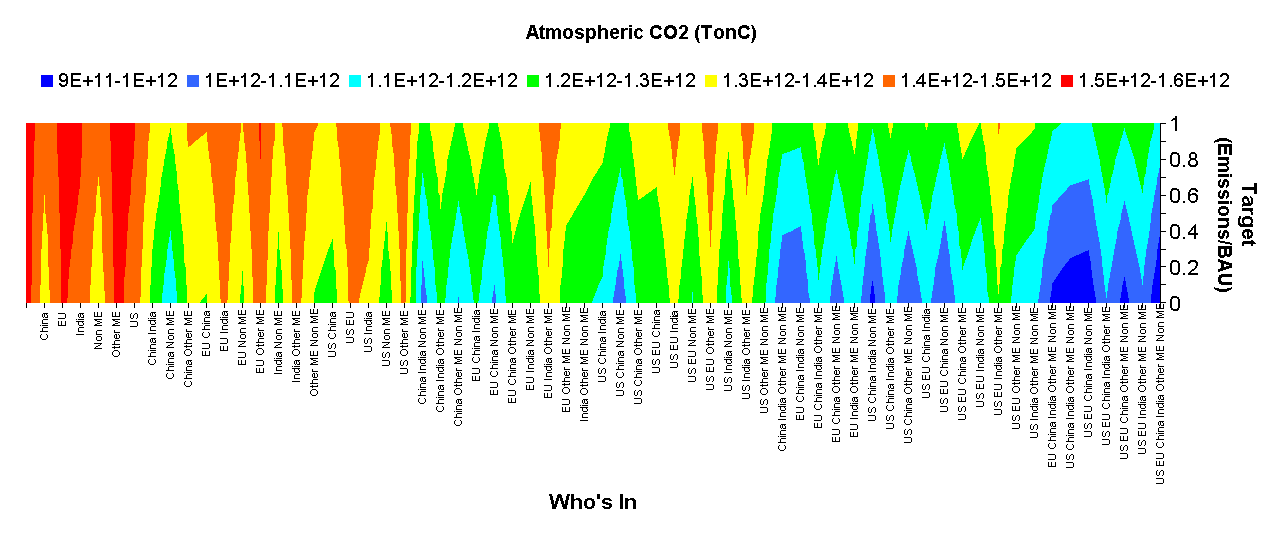
First, a map of what happens to the concentration of atmospheric CO2 as a function of an emissions target to which participating regions adhere (y axis) and the regions participating (enumerated on the x axis). This is basically an elaboration of everyone plays. The color scheme on the surface shows atmospheric CO2 concentration in 2100 in slightly cryptic units (TonC). The important thing to know is that the bluest end of the scale (all in, aggressive targets) succeeds in staying under 466ppm, the reddest end (no action) is a disaster at up to 750ppm, and the green and turquoise bands are near 2x CO2. Click the graphic for a larger version.
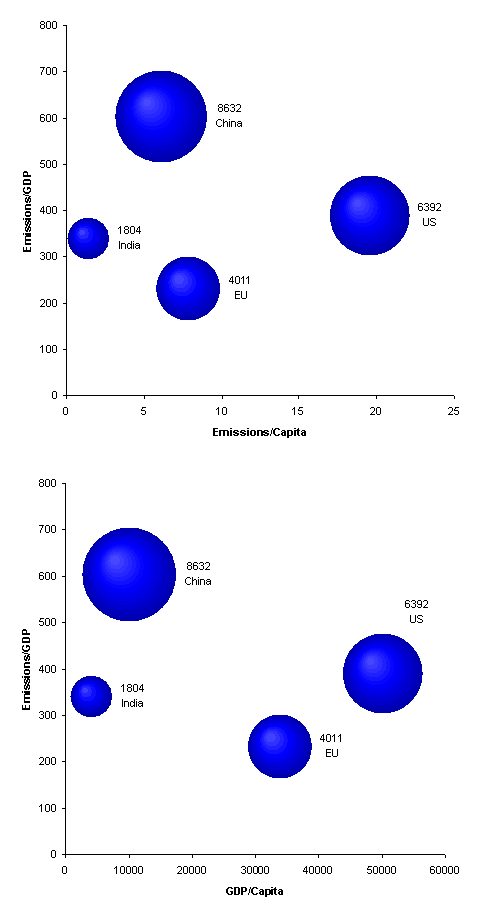
Second, a visual version of some of the data in the reduction illusion. Bubble size is proportional to regional CO2 emissions in 2015.
Climate War Game – Reduction Illusion?
Is the cup half empty or half full? It seems to me that there are opportunities to get tripped up by even the simplest emissions math, as is the case with the MPG illusion. That complicates negotiations by introducing variations in regions’ perception of fairness, on top of contested value judgments.


