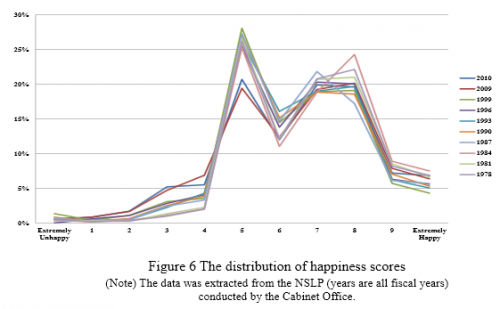
At the Balaton meeting, I picked up a report on happiness in Japan, Measuring National Well-Being – Proposed Indicators. There’s a lot of interesting material in it, but a figure on page 14 stopped me in my tracks:
 The distribution of happiness scores is rather strongly bimodal, and has been stable that way for 30+ years.
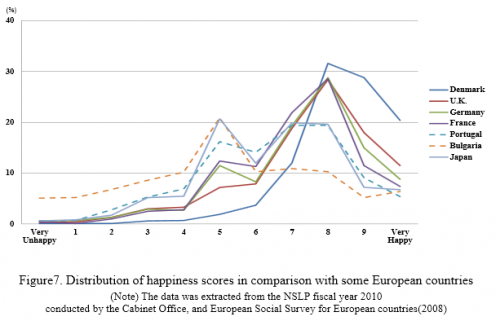
There might be an obvious explanation: heterogeneity – perhaps women are happy, and men aren’t, or the reverse, or maybe a lot of people just like to answer “5”. But the same thing appears in some European countries:
 Denmark is obscenely happy (time to look for an apartment in Copenhagen) but several other countries display the same dual peaks as Japan. I wouldn’t expect the same cultural dynamics, so what’s going on?
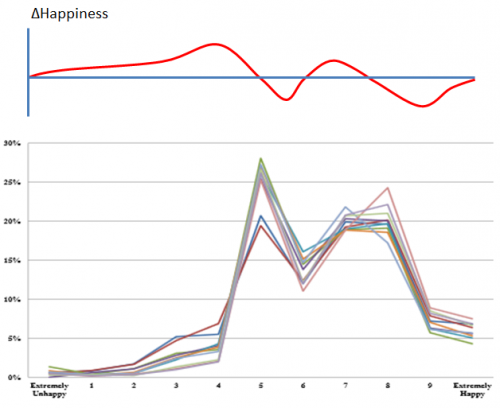
A tantalizing possibility is that this is the product of a dynamic system. But if so, it’s 1D representation would have to look something like,
 That’s really rather weird, so perhaps it’s just an artifact (after all, bimodality doesn’t appear everywhere). But since happiness is largely a social phenomenon, it’s certainly plausible that the intersection of several feedbacks yields this behavior.
I find it rather remarkable that no one has noted this – at least, google scholar fails me on the notion of bimodal happiness or subjective well being. A similar phenomenon appears in text analysis of twitter and other media.
Any theories?

Interesting observation, Tom!
Offhand I cannot put my finger on any formal research that specifically addresses the topic so I am forced to respond from more of a gut feel perspective.
Methinks humans are, as a generality, optimistic which in my behavioral psych research tends to equate to overly positive ratings so I would tend to expect the distribution to peak in the 7 to 8 range (the European plots fit my mental image well). There is significant research along these lines related to self image. For example studies of people rating their driving skills shows something like 80 percent rating themselves “above average” which is clearly impossible. This “self illusory” bias tends to be pretty common, is well documented, and could potentially translate into a “happiness index bias”. Looking at the plots I would tend to say that assuming happiness SHOULD be centered around 5, a positive bias is clearly evident as only a small percentage rate themselves below 5. (Another alternative is that things really are good for most of the people tested.) My general conclusion is to suspect that individuals generally have a positive bias and to infer that they are reluctant for some reason to admit that they are unhappy.
So given a distinct bias, why is the curve bimodal and not smooth centered on some positive point (such as 7)? I suspect those who are less happy encounter a psychological barrier at 5 and subconsciously refuse to acknowledge they are unhappy – to either themselves or the test. This would suggest that the peak at 5 represents people who “should have” rated their happiness at some lower level (if accurately stating their happiness).
Now for the differences in the plots between Japan and Europe. I suspect that the patterns are driven more by culture rather than systemic influences but have no basis to cite. Perhaps the Japanese have higher expectations/ambitions than Europeans leading more to be “unhappy” but unwilling to acknowledge it? (I feel like there may be a kernel of truth in that speculation but I don’t have the data to confirm or deny it other than to cite the academic determinism of many Japanese/Orientals.)
I look forward to other’s thoughts!
Jay
I’ve heard a similar argument for Switzerland’s high suicide rate – high standards rather than low happiness.
A possible dynamic mechanism might be self-sorting – happy people hang out together, reinforcing their feelings, and unhappy people do the same?
This is an interesting observation!
One positive feedback that affects happiness is Fredrickson’s “broaden and build” effect (positive emotions -> more awareness of a larger context -> more discovery of new knowledge and building new resources -> increased probability of experiencing positive emotions in the future). See http://www.unc.edu/peplab/publications/Fredrickson%202013%20Updated%20Thinking.pdf
So my guess is that there is a tipping point somewhere around happiness level 6 after which the “broaden and build” loop starts to dominate (up to a point), while at lower levels happiness would tend to converge around level 5.
Interesting.
It does seem like a possible explanation could be (a) some people gravitate towards 5 because they don’t have a good basis for judging happiness, and therefore choose the middle, while (b) positive feedback tends to polarize happiness to high/low values, creating a second peak.